Make xCode great again
xCode simulator debug Estimated reading time: 15 minutes- Swift build time optimization
- Skip recompile every file
- Modify settings for xCode
- Clean-up Run Script Phase
- Find slow code
- Build Active Architecture Only
- Select proper SWIFT_OPTIMIZATION_LEVEL
- Compilation mode
- DEBUG_INFORMATION_FORMAT
- Disable Spotlight indexing for build-cache folders
- Exclude u’r project’s folder from iCloud sync (bird)
- App architecture
- Watch u’r language
- Cocoapods and other dependency managers
- Debug hints
- Helpful arguments and Environment variables
- Simulator hints
- Resources
We often use 3rd party solutions for different tasks when developing apps for iOS/macOS or other Apple platforms. Different functionality that these 3rd party tools provide for us is easy-to-use and saves our time (for example, debug DB, record video from a simulator, check localization, etc).
The big problem, in my opinion, with xCode, is that this IDE has a lot of “hidden” functionality, which is (as usual) poorly documented and so hidden from the biggest part of developers. I would like to put in this article some of these features, that can help the average developer in everyday life.
I think, few, most interesting topics are:
- Swift build time optimization
- Debug hints
- Helpful arguments and Environment variables
- Simulator hints
Swift build time optimization
When I switched to Swift from Objective-C, the main problem for me always was build time. On Swift v.2, I have a project that builds on average for 40 min. Another one, which was much bigger and complex, but written in Obj-C, builds just in 14 sec. U can imagine how I was disappointed regarding “new and awesome language, the best that has been created ever”.
As result, I started to search and experiment with different approaches and parameters. This all helps me understand a bit better build system and collect a bunch of tips for build time improvements.
For now, with Swift 5.x, we haven’t such problems as within prev versions. But still, these tips can be useful for someone.
This issue is not new, and Apple knew about this.
As example u can check this issues SR-2461, SR-1465, SR-1707, SR-663, SR-8314 and many-many other
Luckily for us, they improve this process from time to time. From Xcode 8.2 beta 2 release note
Xcode will not rebuild an entire target when only small changes have occurred. (28892475)Meanwhile, we can do everything that possible from our side.
Skip recompile every file
Set HEADERMAP_USES_VFS to YES to prevent recompile every file of your project for each build.

Modify settings for xCode
Set defaults write com.apple.Xcode PBXNumberOfParallelBuildSubtasks 4. This tells xCode how many parallel builds (files) can proceed. Usually great if equal to the number of cores available.
To find the number of cores on your mac -
sysctl -n hw.ncpu
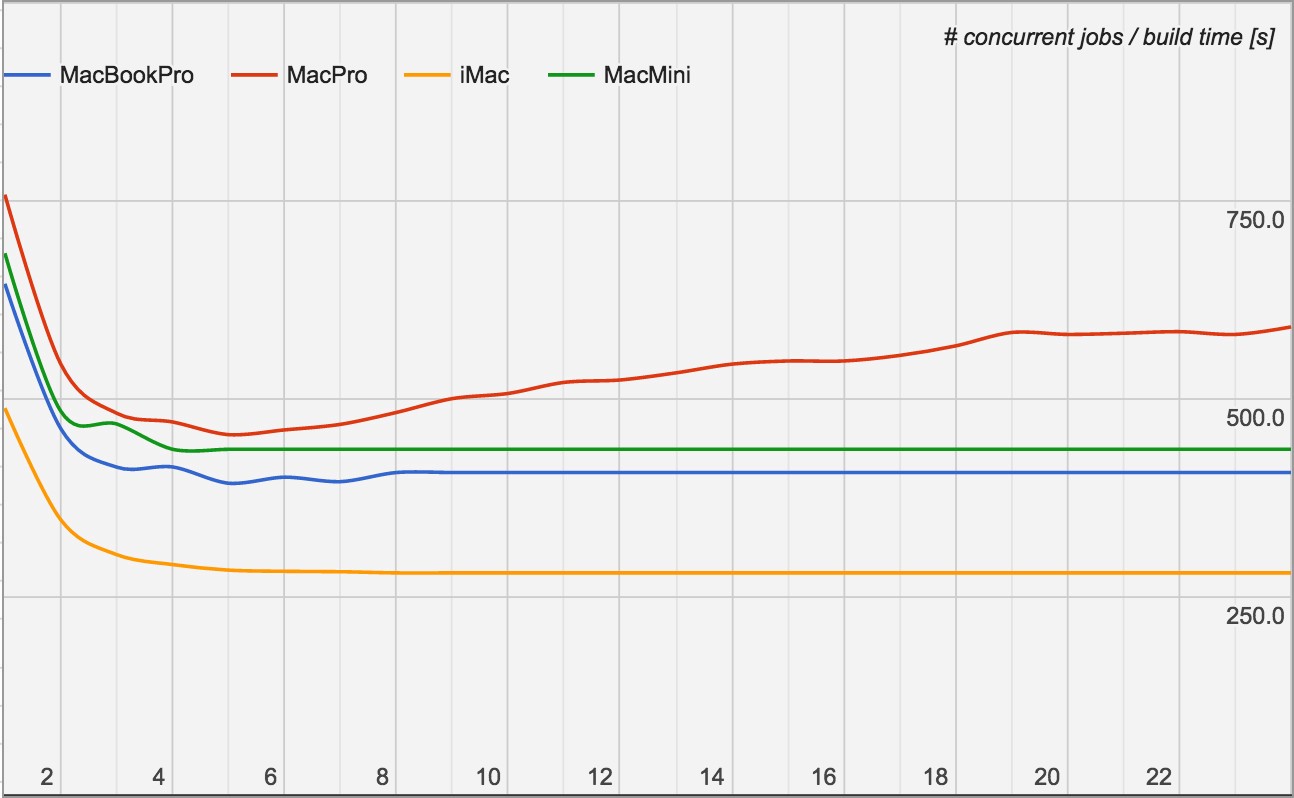
Similar option defaults write xcodebuild IDEBuildOperationMaxNumberOfConcurrentCompileTasks 4. The name tells us, that this setting change the number of parallel compilations in xCode. In general, u would like to reduce the number of jobs, to improve build time. But, the optimal number depends on u’r hardware.
I grab this graph with experiments result from here:
alternative way - use this key as a prameter for build:
xcodebuild -IDEBuildOperationMaxNumberOfConcurrentCompileTasks=1
For both settings be careful when changing it. Improper change may lead to worse build time. So experiment and use wisely.
Read this thread for more
One more interesting setting defaults write com.apple.dt.Xcode BuildSystemScheduleInherentlyParallelCommandsExclusively -bool NO - increases the number of concurrent build tasks that are run for Swift projects.
Clean-up Run Script Phase
U may also check u’r Run Script Phase scripts. Some of them may eat additional time, but may be unnecessary for debug build.
Find slow code
To do so, we can use few options.
The first one is to use defaults write com.apple.dt.Xcode ShowBuildOperationDuration -bool YES. This setting allows to see build time for different files and code blocks. U may wonder, that even a change in 1 line of code can bring a huge build time-reduction effect.
Another option is to add into Other Swift Flag value -warn-long-function-bodies=300 and -warn-long-expression-type-checking=300 where 300 is limit of miliseconds for function/expression compilation.
This allows u to simply refactor code and improve compilation.
Build Active Architecture Only
Set Build Settings / Architectures / Build Active Architecture Only to YES. This will reduce the amount of code that needs to be generated during every build.
Release build should contain all architectures

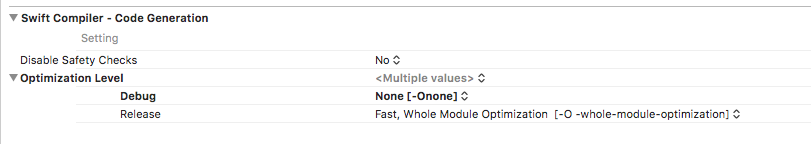
Select proper SWIFT_OPTIMIZATION_LEVEL
Optimization is a great way to reduce u’r time but at some cost.
I don’t want to reinvent the wheel and just post a quote from this source here:
The first thing one should always do is to enable optimization. Swift provides three different optimization levels:
-Onone: This is meant for normal development. It performs minimal optimizations and preserves all debug info.
-O: This is meant for most production code. The compiler performs aggressive optimizations that can drastically change the type and amount of emitted code. Debug information will be emitted but will be lossy.
-Size: This is a special optimization mode where the compiler prioritizes code size over performance.
There is also a -Ounchecked mode that is meant for specific libraries or applications where one is willing to trade safety for performance. The compiler will remove all overflow checks as well as some implicit type checks. This is not intended to be used in general since it may result in undetected memory safety issues and integer overflows. Only use this if you have carefully reviewed that your code is safe with respect to integer overflow and type casts.
For production builds always use -Owholemodule level, read this for more. This mode is enabled using the swift command line flag -whole-module-optimization.
There is also another Apple LLVM optimization
GCC_OPTIMIZATION_LEVEL. In general, u shouldn’t touch this setting if u working with Swift only. This has a play if u work with Obj-C, C++, or C
Compilation mode
There is a setting in xCode that controls the way the Swift files in a module are rebuilt - SWIFT_COMPILATION_MODE.
Incremental - only rebuild the Swift source files that are was modified or marked as “needs to rebuild” due to other reasons.
Wholemodule - always rebuild the whole project.
DEBUG_INFORMATION_FORMAT
Build Options → Debug Information Format (DEBUG_INFORMATION_FORMAT) is set to DWARF for Debug builds.
This setting allows selecting the format used to store the binary’s debug information.
Possible values:
stabs: Use the Stabs format and place the debug information in the binary.dwarf: Use the DWARF format and place the debug information in the binary.dwarf-with-dsym: Use the DWARF format and place the debug information in a dSYM file.
About DWARF. Another great post about types of Debug information format is here.

Disable Spotlight indexing for build-cache folders
Sometimes Spotlight can eat a lot of time for indexing the build folder. I didn’t feel the impact, but other tell, that this can helps a lot.
In general, u should exclude u’r build folder such as ~/Library/Developer and ~/Library/Caches.
To do so, follow next steps:
- Launch System Preferences from the Apple menu and choose the “Spotlight” preference panel
- Click on the “Privacy” tab
- Drag & drop folders or drives to exclude from the Spotlight index, or click the “+” plus icon in the corner to manually select hard drives or directories
Exclude u’r project’s folder from iCloud sync (bird)
This can free for u’r mac a lot of CPU resources. To do so, just add .nosync to your folder name at the end. This tells macOS to not sync the selected folder in iCloud.
App architecture
Some architecture for application (for example Modular Architecture) allows dividing code into separate subprojects. So when u compile the current one, parts in submodules are not rebuilt. This is great but looks like a mostly workaround (if we think only about build time).
Watch u’r language
As I mentioned above, code itself is the major part of a big compilation time issue. So u need to be careful when u have a deal with a complex expression that may require complex operation for the compiler.
I remember a time when a dictionary without explicit type and 10 different values can compile infinitely.
So in general there are a few rules for optimal build time when u have a deal with Swift:
- Minimize chained function
- Use safe unwrapping for the optional (instead of !)
- Use explicit type for variables
- Avoid ?? operator (this one may be extremely hungry!!)
- Avoid ?: operator
- Avoid a complex expression
- Avoid similar type convertion (for example CGFloat to Float and vice-versa)
- reduce dynamic dispatch
- use
final,private,fileprivatewhenever possible - struct over classes (if applicable)
- use copy-on-write whenever possible
- let over var when captured
Other optimization tips for code available here
I recommend using swiftlint or some other static code analyzer with custom rules, that prevent complex expression and other constructions that can grab a lot of u’r time during project building.
Cocoapods and other dependency managers
Cocoapods is a great way to get ready-to-use code. But sometimes this may require additional time for compilations. Use different options described above to improve the build time of cocoa pods.
For example, u may add an additional step in your Podfile, like:
post_install do |installer|

  puts("Update pod settings...")
  installer.pods_project.targets.each do |target|
    target.build_configurations.each do |config|

      # reduce build time
      config.build_settings['OTHER_SWIFT_FLAGS'] = ['$(inherited)', '-Onone']
      config.build_settings['SWIFT_OPTIMIZATION_LEVEL'] = '-Owholemodule'

    end
  end

  puts("Update debug pod settings to speed up build time")
  Dir.glob(File.join("Pods", "**", "Pods*{debug,Private}.xcconfig")).each do |file|
    File.open(file, 'a') { |f| f.puts "\nDEBUG_INFORMATION_FORMAT = dwarf" }
  end

end
One more option with pods - is to turn them into static frameworks. Check this plugin for more.
And check alternatives for cocoapods Carthage used as a prebuilt framework/library, so it’s faster. Swift Package Manager even faster. Submodule only builds when u perform a clean build.
Debug hints
During debug, we always want to get as much information as possible. Basically, information is all that we need :).
llvm
The first hint - is to remember, that u can use all llvm commands, not only po or e.
There are also few less popular but very usefull:
frame- information aboutframe, usefull within diff combinations (frame v)process- information about a process (exampleprocess status)breakpoint- information about breakpoints (example -breakpoint list)thread- information about threads (examplethread list)bt- thread backtrace platform - platform status s - наступний крокс- continuehelp- help :]script- u can use for example Python for u’r own commands- others
Note: there is more than 100 commands, and u can even add u’r own. So know u’r tool.
Debug snippets
Also, xCode provides a lot of useful API for debugging.
On any layout issue u can use next snippet:
expr -l objc++ -O -- [[UIWindow keyWindow] _autolayoutTrace]This will tell u detailed information about the autolayout issue.
If u faced with issue when llvn tells u that can’t inspect value, u can do next:
expr -l Swift -- import UIKit
expr -l Swift -- unsafeBitCast(0x7f88a8cc2050, to: UIView.self).backgroundColor = UIColor.red
Symbolic breakpoints
This is a great technique, but rarely used type of breakpoints. Symbolic breakpoint allows u to stop execution in code or library, even if u haven’t access to it, by using special Symbol, function name like NameClass.NameMethod or -[NameClass NameMethod].
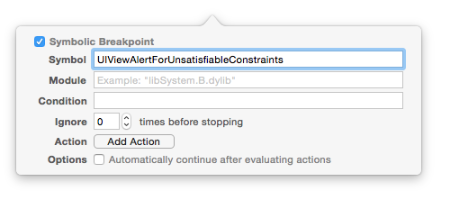
Here are a few great symbols that I use in everyday development:
UICollectionViewFlowLayoutBreakForInvalidSizesUIColorBreakForOutOfRangeColorComponentsUIViewAlertForUnsatisfiableConstraints-[UIViewController _endAppearanceTransition:]-[UIImage imageNamed:](to detect the name of images that not exists)-[UIApplication main](to stop app on start and inject something (using filedDebugger command), for example,exp @import UIKitto loadUIKitfor fasterpocommands)-[UIView(UIConstraintBasedLayout) _viewHierarchyUnpreparedForConstraint:]-[UIViewController dealloc]+ actionSoundand--- dealloc @(id)[$arg1 description]@in debug console to print message about dealloc of object. For UIViewController if u can’t see any message, this means that u have a retain cycle or improper memory usage.
Helpful arguments and Environment variables
Another way to improve u’r work with xCode is to use Arguments and/or Environment variables in xCode.
To use it, simply add into special section in target configuration:
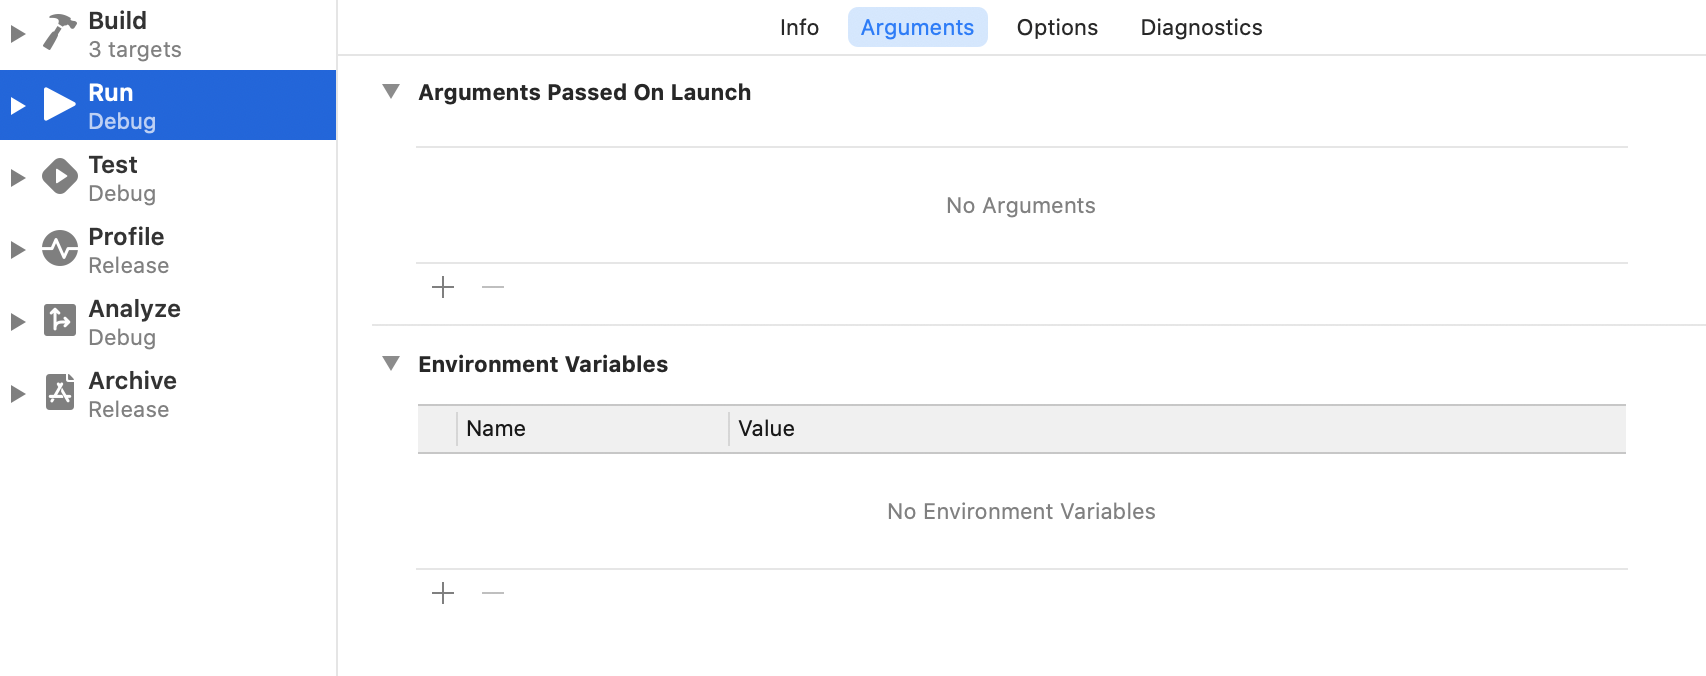
Arguments
Arguments allow additional functionality and options during program execution. Sometimes it’s better than any other tools and can provide detailed information about the process and error (if any).
CoreData
| Launch Option | Values | Usage |
|---|---|---|
| -com.apple.CoreData.SQLDebug | 1,2,3 | Increasingly verbose log levels for SQL generated by CoreData |
| -com.apple.CoreData.SyntaxColoredLogging | YES, NO | Make CoreData logging colorful |
| -com.apple.CoreData.MigrationDebug | YES, NO | Enables additional logging for CoreData migrations |
| -com.apple.CoreData.ConcurrencyDebug 1 | 1 | Enables concurrency checks for NSManagedObject contexts - crash if used on an incorrect thread |
| -com.apple.CoreData.SQLiteIntegrityCheck | 1 | Run an SQLite integrity check on initialization |
| -com.apple.CoreData.Logging.stderr | 1-3 | needed alongside with the SQLDebug from iOS 10+ because of new logging system, more on that in changelog |
| -com.apple.CoreData.SQLiteDebugSynchronous | 1 | preference controls some aspects of the SQLite store. See the “Configuring a SQLite Store’s Save Behavior” section of the Core Data Programming Guide for details |
| -com.apple.CoreData.ThreadingDebug | preference enables assertions to enforce Core Data’s multi-threading policy. It is a number, where increasing values enable more debugging. A value of 3 is recommended. This feature requires the debug variant of the framework |
Localization
| Launch Option | Values | Usage |
|---|---|---|
| -AppleLocale | Any locale identifier (e.g. ‘en’, ‘it’, ‘es’) | Force the locale on app launch |
| -NSDoubleLocalizedStrings | YES, NO | Doubles the length of all localized strings, e.g. “Word” => “Word Word” to debug layout issues |
| -NSShowNonLocalizedStrings | YES, NO | Shows non-localized strings in ALL CAPS so they’re easier to spot |
| -NSForceRightToLeftWritingDirection | YES, NO | YES to force right-to-left mode to engage (even in non-RTL languages) |
| -AppleLanguages | starts the app with selected locale | |
| -com.apple.CoreData.Logging.stderr | 1-3 | needed alongside with the SQLDebug from iOS 10+ because of new logging system, more on that in changelog |
| -com.apple.CoreData.SQLiteDebugSynchronous | 1 | preference controls some aspects of the SQLite store. See the “Configuring a SQLite Store’s Save Behavior” section of the Core Data Programming Guide for details |
| -com.apple.CoreData.ThreadingDebug | preference enables assertions to enforce Core Data’s multi-threading policy. It is a number, where increasing values enable more debugging. A value of 3 is recommended. This feature requires the debug variant of the framework |
Layout and State Restoration
| Launch Option | Values | Usage |
|---|---|---|
| -UIViewLayoutFeedbackLoopDebuggingThreshold | number of iterations to consider a loop | Enables the Layout Feedback Loop Debugger, and sets the time threshold that triggers it |
| -UIStateRestorationDebugLogging | YES, NO | Enables state restoration to debug logging for debugging issues with application state restoring |
| -UIStateRestorationDeveloperMode | YES, NO | Keeps the state restoration info even if the app crashes |
| -UIViewShowAlignmentRects | YES, NO | shows alignment reacts in UI |
| -UIFocusLoggingEnabled | YES, NO | See how the focus engine determines which view is currently in focus by turning on live focus logging. As the user moves focus, the log updates, showing how the new view came into focus. In your Xcode project, select Edit Scheme and add -UIFocusLoggingEnabled YES to the Arguments Passed On Launch section. https://developer.apple.com/documentation/uikit/focus-based_navigation/debugging_focus_issues_in_your_app |
| -_UIConstraintBasedLayoutPlaySoundOnUnsatisfiable | YES, NO | Debug your AutoLayout constraints with Sound Notification |
| -com.apple.CoreData.SQLiteDebugSynchronous | 1 | preference controls some aspects of the SQLite store. See the “Configuring a SQLite Store’s Save Behavior” section of the Core Data Programming Guide for details |
| -com.apple.CoreData.ThreadingDebug | preference enables assertions to enforce Core Data’s multi-threading policy. It is a number, where increasing values enable more debugging. A value of 3 is recommended. This feature requires the debug variant of the framework |
If you want to handle parsing the options on your own:
ProcessInfo.processInfo().arguments
Environment variables
Environment variables allows also change the behavior of the app during execution and building.
There are a lot of them…
I use only a few of them often. Here they are:
| Variable | Value(s) | Usage |
|---|---|---|
| CFNETWORK_DIAGNOSTICS=3 | 0,1,2,3 | 0: Off, 3: Most Verbose - Use with caution, may leak SSL data on your simulator/device |
| DYLD_PRINT_STATISTICS=1 | More options documented here | |
| OS_ACTIVITY_MODE=disable | info, debug, disable | Sets the logging mode of the launched process to the specified level. See man log for more details. |
| OBJC_HELP | Dumps out a list (during app launch) of other environment variables that vary depending on OS version | |
| CG_PDF_VERBOSE | describe pdf creation details | |
| NSZombieEnabled | YES, NO | If set to YES, deallocated objects are ‘zombified’; this allows you to quickly debug problems where you send a message to an object that has already been freed. |
| NSDeallocateZombies | YES, NO | If set to YES, the memory for ‘zombified’ objects is actually freed. |
| NSUnbufferedIO | YES, NO | If set to YES, Foundation will use unbuffered I/O for stdout (stderr is unbuffered by default). |
There is a way how to extract all variables and check values. Read here.
Simulator hints
And the last for this article, but not least - few hints for the simulator.
Use Simulator in full-screen mode with Xcode
defaults write com.apple.iphonesimulator AllowFullscreenMode -bool YES
Launch a few simulators
-
Get the list
xcrun simctl list -
Open
open -n /Applications/Xcode.app/Contents/Developer/Applications/iOS\ Simulator.app/ --args -CurrentDeviceUDID <UUID from list>
CaptureVideo
xcrun simctl io booted recordVideo (filename).(extension)
CaptureScreenshot
xcrun simctl io booted screenshot myScreenShot.png
Add media to simulator
xcrun simctl addmedia booted <path to media>
Collect logs from simulator
xcrun simctl spawn booted log stream — level=debug
URL Scheme test
xcrun simctl openurl booted <URL>
xcrun simctl openurl booted SMS: #Messages
Remove all unavailable simulators
xcrun simctl delete unavailable
Erase all simulators
xcrun simctl erase all
to check all commands simply type
xcrun simctl help
Resources
Share on: