#include <sys/ptrace.h>
ptrace debug Estimated reading time: 5 minutesWhat do we often think that debugging is? Is this just a bug fix? Let’s check the definition of this word - according to Oxford vocabularie its the process of identifying and removing errors from computer hardware or software.
But does it only this? As for me, this process is also a process of getting an understanding of how the software works, and what’s going on under the hood.
To understand this, we must understand the mechanism of how we can debug some process - another process: ptrace (process trace).
process
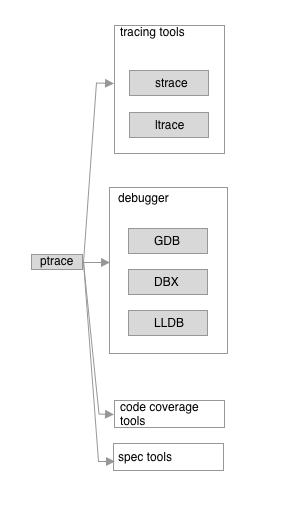
This service is used by different processes:
To be more precise - this is a system call - low-level service provided by the kernel, the programmatic way in which a computer program requests a service from the kernel of the operating system on which it is executed.
In general, ptrace get all info about the process and as result, we can use it to read/write the memory and inspect and manipulate the process itself using various tools.
The definition:
long ptrace(enum __ptrace_request request, pid_t pid,
                   void *addr, void *data);
We can open /usr/include/sys/ptrace.h and there we can found slightly modified declaration for Apple platforms:
int ptrace(int _request, pid_t _pid, caddr_t _addr, int _data);The difference, as u can see, it’s a concrete type for addr and _data.
U probably don’t find any header file for iOS, thus this is not a part of a public API for iOS developers. To use
ptracewe can obtain a pointer to it and after performing needed operations:#import <sys/types.h> #import typedef int (*ptrace_ptr_t)(int _request, pid_t _pid, caddr_t _addr, int _data); void functionWithPtrace() { ptrace_ptr_t ptrace_ptr = (ptrace_ptr_t)dlsym(RTLD_SELF, "ptrace"); ptrace_ptr(31, 0, 0, 0); // example call PT_DENY_ATTACH }
how it works
ptrace is used by some process (the tracer) to spy a tracee process only if the tracee permits it. To make it possible, the tracee must call ptrace itself (with correct arguments) to be “traceable”.
ptrace function
__ptrace_request
The first argument __ptrace_request determines the behavior of ptrace and how other arguments are used.
To review all params expand this
#define	PT_TRACE_ME	0	/* child declares it's being traced */
#define	PT_READ_I	1	/* read word in child's I space */
#define	PT_READ_D	2	/* read word in child's D space */
#define	PT_READ_U	3	/* read word in child's user structure */
#define	PT_WRITE_I	4	/* write word in child's I space */
#define	PT_WRITE_D	5	/* write word in child's D space */
#define	PT_WRITE_U	6	/* write word in child's user structure */
#define	PT_CONTINUE	7	/* continue the child */
#define	PT_KILL		8	/* kill the child process */
#define	PT_STEP		9	/* single step the child */
#define	PT_ATTACH	10	/* trace some running process */
#define	PT_DETACH	11	/* stop tracing a process */
#define	PT_SIGEXC	12	/* signals as exceptions for current_proc */
#define PT_THUPDATE	13	/* signal for thread# */
#define PT_ATTACHEXC	14	/* attach to running process with signal exception */

#define	PT_FORCEQUOTA	30	/* Enforce quota for root */
#define	PT_DENY_ATTACH	31

#define	PT_FIRSTMACH	32	/* for machine-specific requests */
pid
Second argument - PID. The type is pid_t. The pid_t data type is a signed integer type which is capable of representing a process ID. In the GNU library, this is an int.
It’s good to know that each process is named by a process ID number, a value of type pid_t. A process ID is allocated to each process when it is created. Process IDs are reused over time.
To find the process id on mac we can use ps aux | grep -I <name>.
This is an example of searching for PID for my editor for markdown:
ps aux | grep -i MacDown
khorbushko       26769   0,0  0,3 37026308  45032   ??  S    ср01    2:47.14 /Applications/MacDown.app/Contents/MacOS/MacDown
khorbushko       30524   0,0  0,0 408637584   1824 s001  S+   11:37     0:00.00 grep -i MacDown
more about ps.
Alternative - pgrep <name> - just return pid:
pgrep MacDown
26769
void *addr and void *data
This argument is sometimes used by the function. Actual usage depends from __ptrace_request.
For example:
ptrace(PTRACE_PEEKTEXT, PID, addr, NULL) - return a WORD read from the address addr, from the memory of the process PID (the tracee).
data is also dependent and can be used for obtaining some results from the function.
For example:
ptrace(PTRACE_GETREGS, pid, NULL, ®s) - copy a snapsot of the CPU’s registers running the tracee (when it stopped), into a user_regs_struct structure (defined in sys/user.h).
examples I grab from here
errors
Sometimes we can get an error from this function. To understand it we can use explain_ptrace.
const char *explain_ptrace(int request, pid_t pid, void *addr, void *data)
PT_DENY_ATTACH
Apple also defines additional param for request value in the ptrace function. We can check ptrace.h with declaration for more info. One of these param is PT_DENY_ATTACH - disable lldb to attach to the selected process.
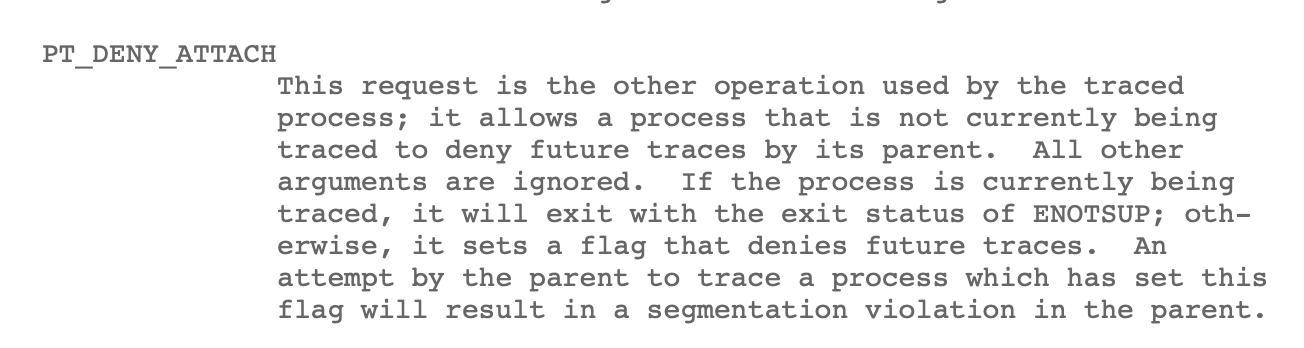
#define PT_DENY_ATTACH 31
We can execute ptrace(PT_DENY_ATTACH, 0, 0, 0) as result, attachment to process become very complicated.
I answered some time ago on SO to a question related to this code execution.
For now, a few workarounds exist to bypass this, so don’t rely on this. Read more here about them and here or here.
A good alternative to PT_DENY_ATTACH in ptrace for protecting the app from being attached/debugged can be another system process - sysctl. Repeatable checking of process state and detecting if the process has to debug attachment or no, can much better protect the app.
Example code that use
sysctl
Conclusion
ptrace very powerful tool that allows us to control and debug (using debugserver) the process. Unfortunately (?) it’s not a silver bullet, but understanding this will help u to better debug and so provide quality code.
ptrace is used by many tools and called all over the different processes in the system.
Resources
Share on: