The LLDB Debugger - Part 1: Basics
lldb clang debug Estimated reading time: 9 minutesDebugging is an essential part of app development for any platform. Luckily for us, Apple-developers, we now use lldb - “a next-generation, high-performance debugger” (source).
In this series of article, I will try to cover some aspects related to debugging process, that I use during debugging (some of them are used not so often, but other - almost all the time).
Articles in this series:
- The LLDB Debugger - Part 1: Basics
- The LLDB Debugger - Part 2: Breakpoints
- The LLDB Debugger - Part 3: Watchpoint
Basic operations
Installation
xCode
If u use xCode, then, u are done.
Manual
In other cases, if u would like to do this without xCode IDE, u should open Terminal and put lldb, hit Enter. The installation will be started automatically.
System setup
U may be faced with issues, that u can’t attach to the process, then, u may try to perform few additional operations:
1) run DevToolsSecurity command - this tool changes the security authorization policies for use of Apple code-signed debugger and performance analysis tools on development systems.
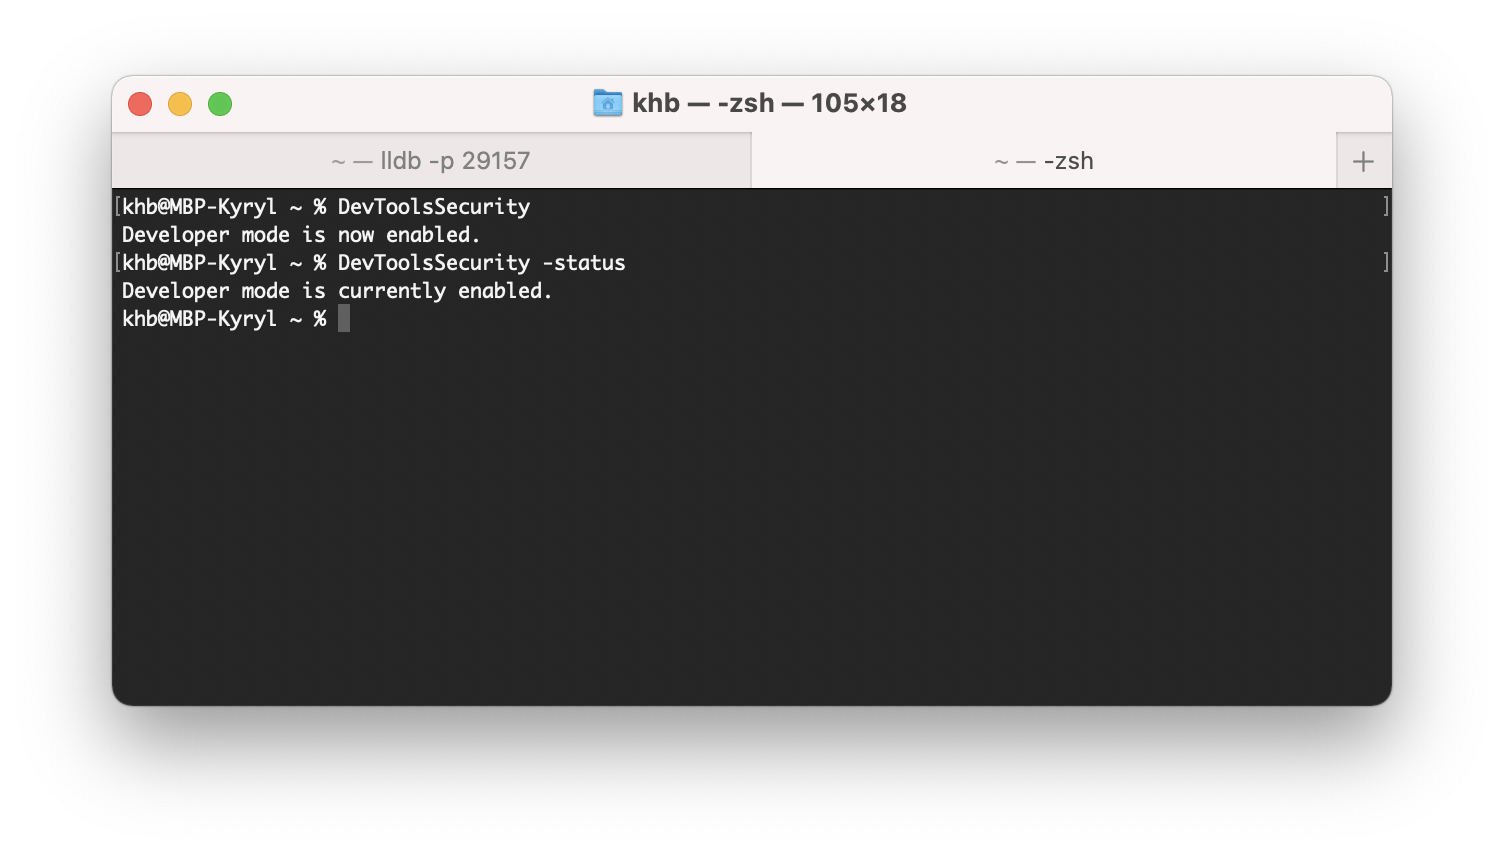
2) Some processes may be protected by system integrity protection. In this case, u may receive a message like this
«error: attach failed: cannot attach to process due to System Integrity Protection»
To “fix” this, u should disable system integrity protection: u need to boot in recovery mode, open the terminal and run
csrutil disableNext, reboot the mac and check status:
csrutil statusIf everything is fine, u will see something like this:
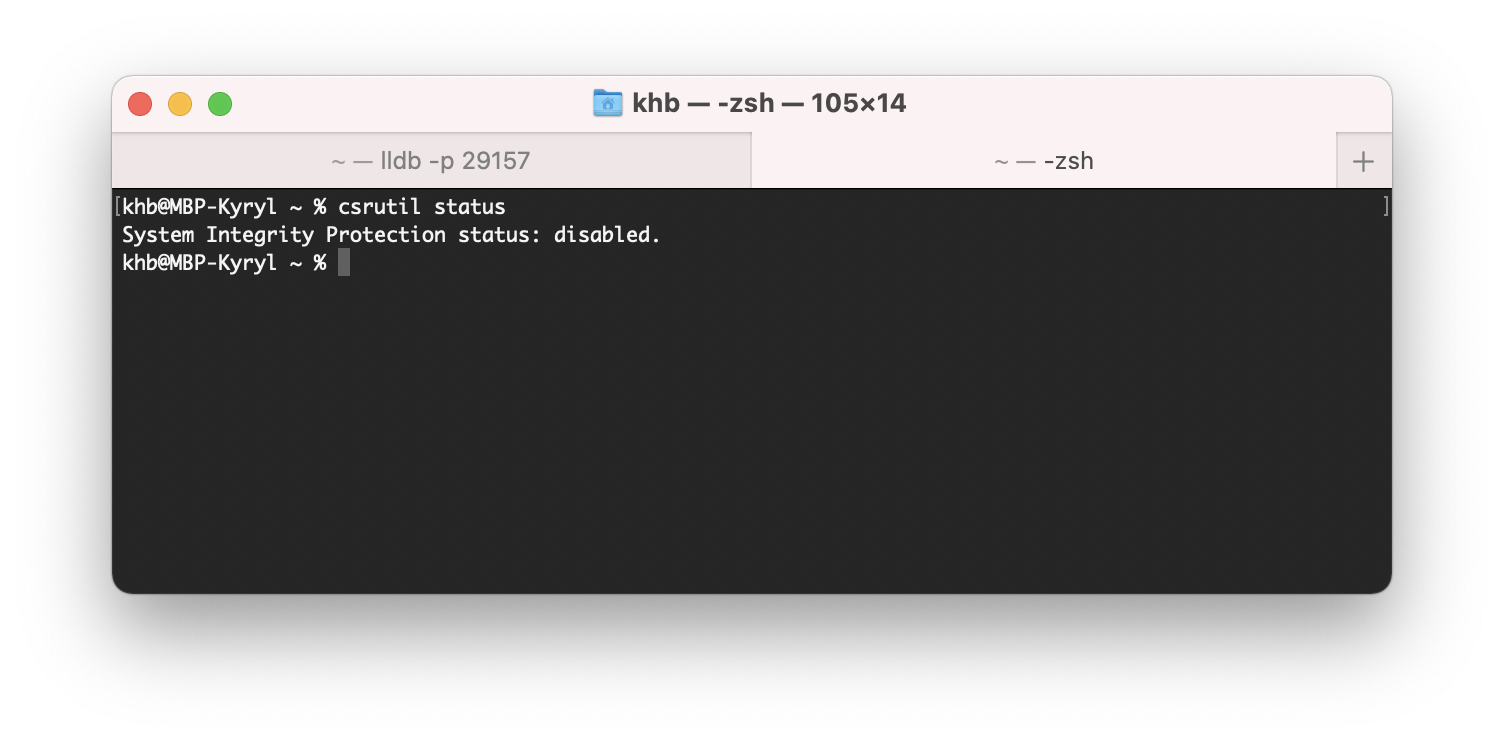
Disable SIP only temporarily to perform necessary tasks, and reenable it as soon as possible. Failure to reenable SIP when you are done testing leaves your computer vulnerable to malicious code. Apple
Launch lldb commands
All commands created for lldb can be used with the next pattern:
<noun> <verb> [-options [option-value]] [argument [argument...]]if the arguments begin with a “-” then you have to tell lldb that you’re done with options for the current command by adding an option termination: “–”.
(lldb) process launch --stop-at-entry -- -program_arg valueThis means, that all that we need to remember - is this one pattern, then, every command / or combіnation of them can be used in the same manner.
In comparison to this example, Apple provides an even more detailed sample:
<command> [<subcommand> [<subcommand>...]] <action> [-options [option-value]] [argument [argument...]]It’s good to know, that every command can have a subset of subcommands and so on.
use
helpcommand to check available documentation for interested command:
(lldb) help <commandToInspect>Attach
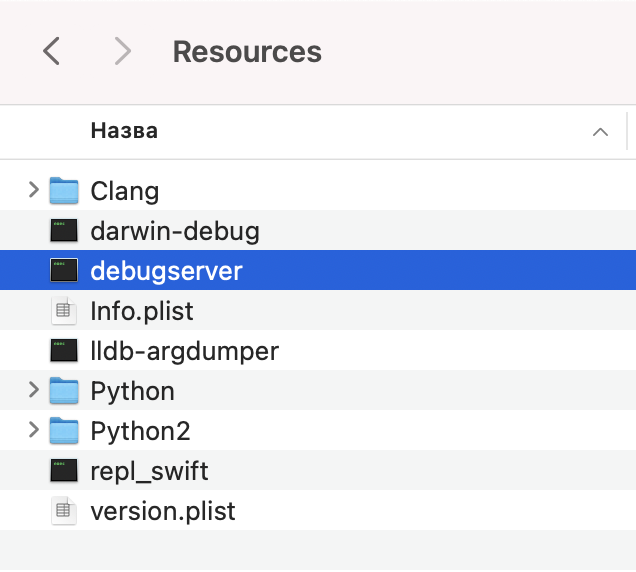
Before we actually can perform some commands and inspect the data, we should attach it to the process. Lldb is not «attaching» to the process, lldb coordinate work with debugserver that can be found at Xcode.app/Contents/SharedFrameworks/LLDB.framework/Resources path
The great thing, that u can perform the same operation using different approaches - this provides great flexibility and usability for lldb debugger, truly - “a next-generation, high-performance debugger”.
Checking the official doc is a good point to start. To save some time, here are few approaches, that can be used in most cases.
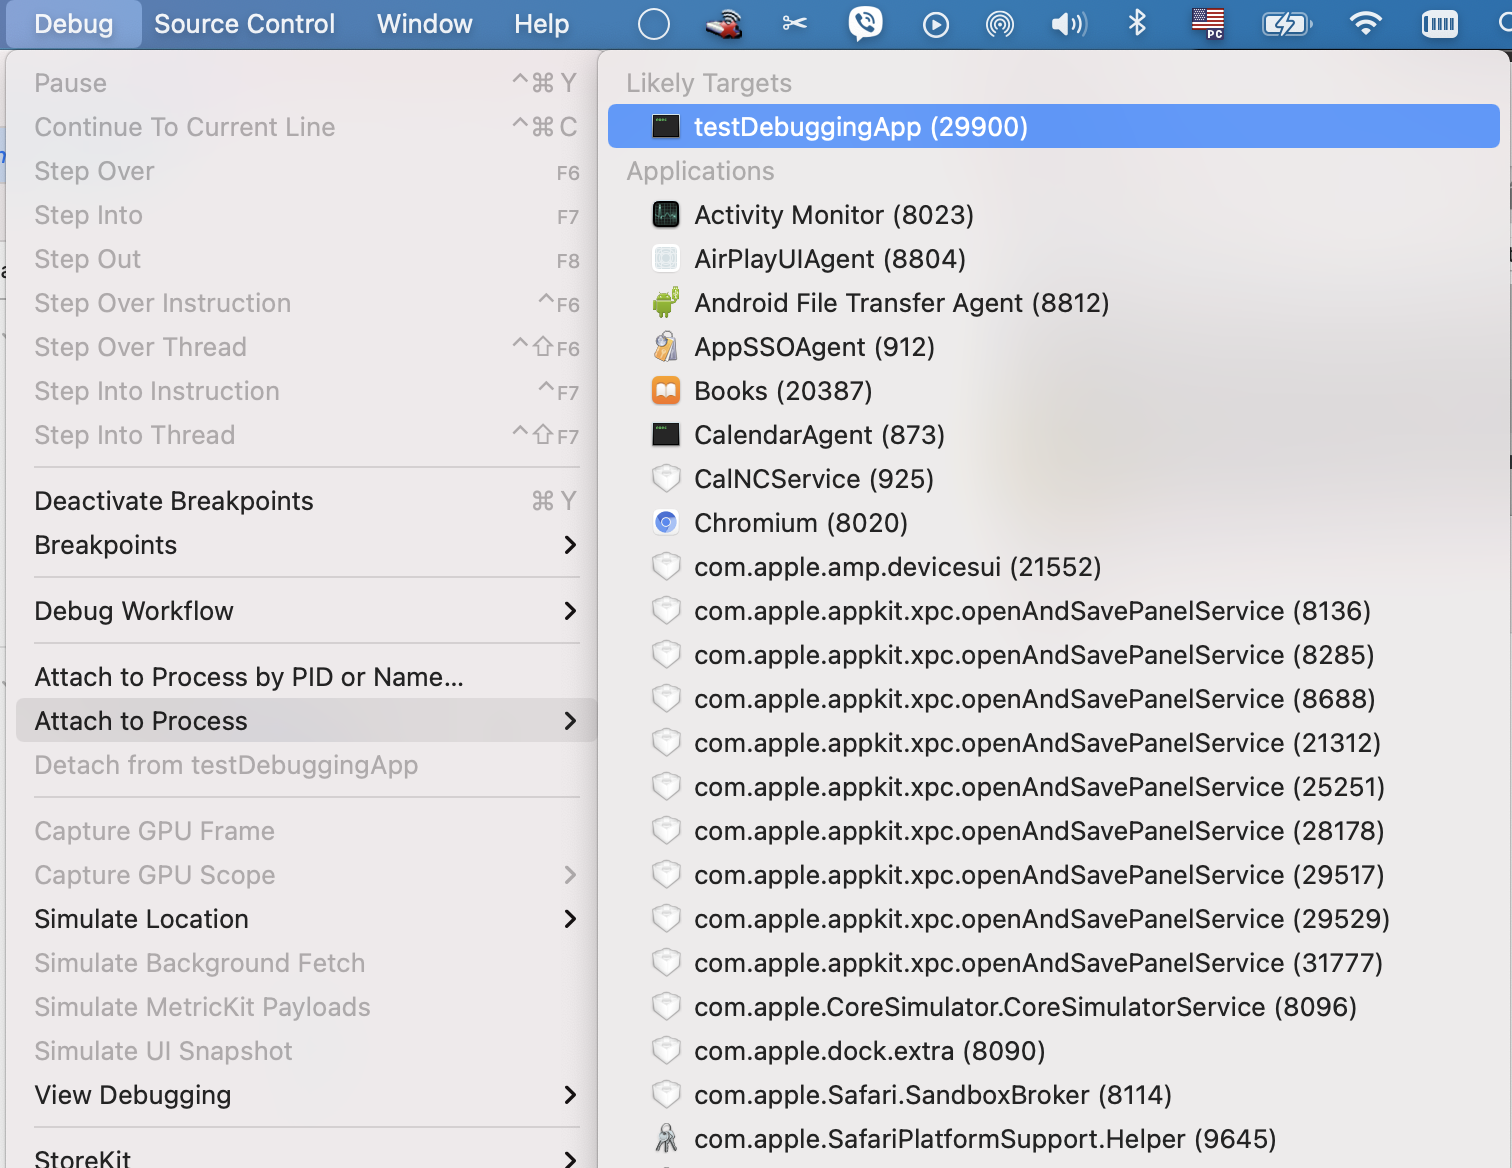
Attaching to process can be also done using xCode, by specially design menu - “Debug”.
using name
The command:
(lldb -n <Application>where:
**-n
** Alias for –attach-name
using PID
PID - the process identifier (a.k.a. process ID or PID) is a number used by most operating system kernels—such as those of Unix, macOS, and Windows—to uniquely identify an active process. wiki
The command:
lldb -p <PID>where:
**-p
** Alias for –attach-pid
Be careful: if u already attached to the process by xCode or in another way, u may receive an error like this one:
error: attach failed: tried to attach to process already being debugged
The good question here - is how to obtain the PID. To do so, we can check manpages for standard Linux commands and find one, that can do this for us:
pgrep - look up or signal processes based on name and other
manis shorted formanual
The command:
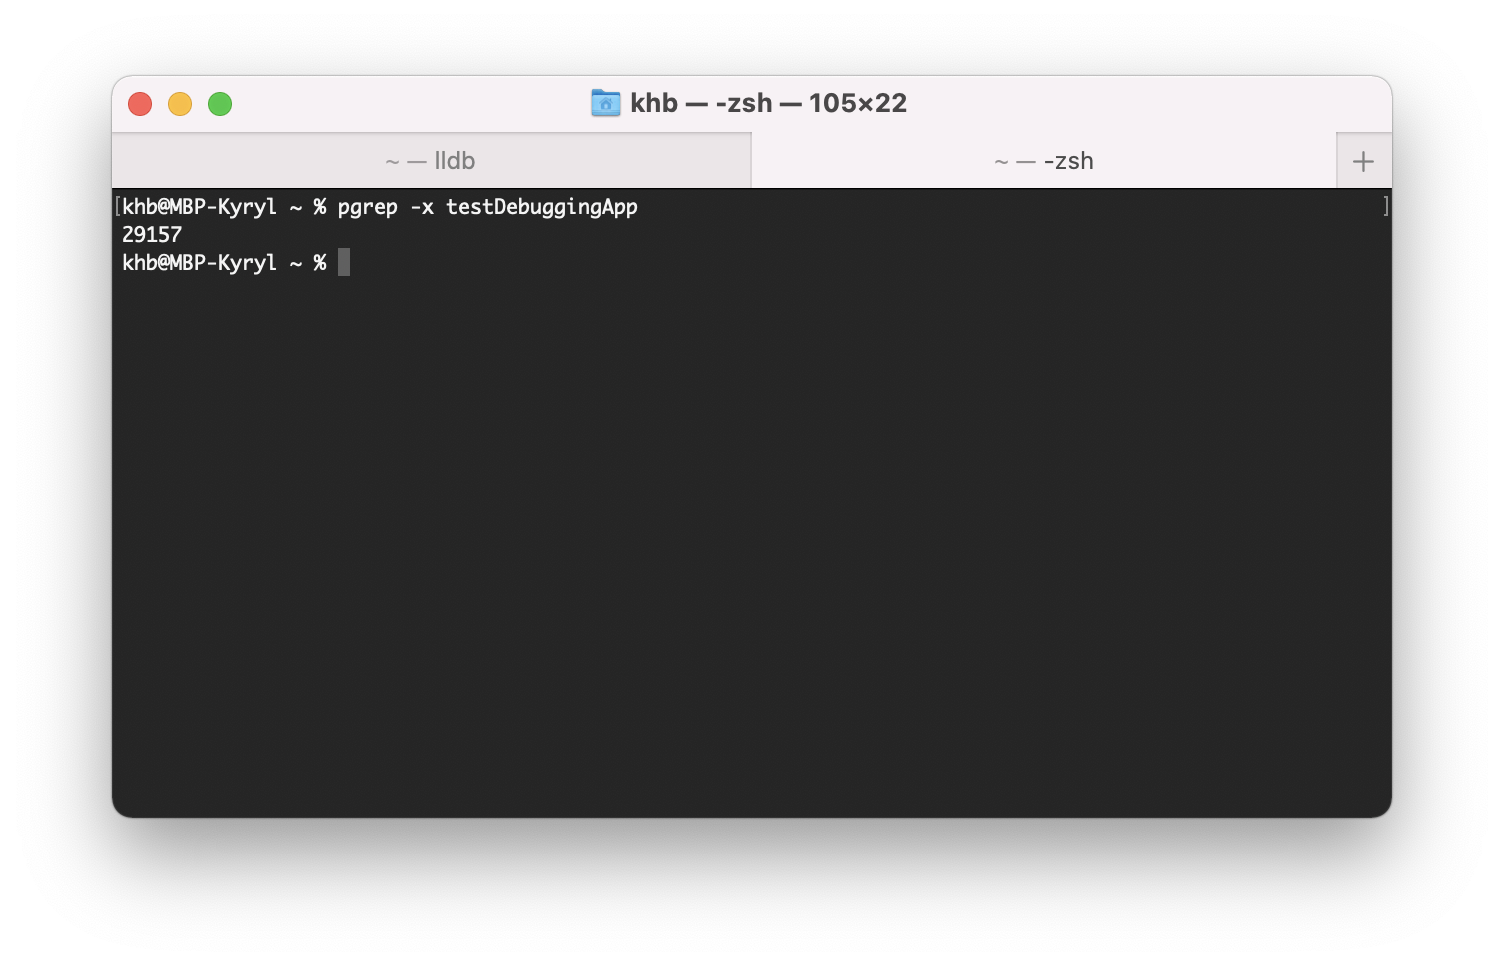
pgrep -x <Application>where:
-x Only match processes whose name (or command line if -f is specified) exactly match the pattern.
I have created a test iOS project with target named testDebuggingApp. After launching it on simulator, we can find the process id for this app. In may case, the result looks like this:
using future process
One more good option - is to be ready to attach to the process before it starts:
lldb -n <Application> -wwhere:
**-n
** Alias for –attach-name –wait-for Tells the debugger to wait for a process with the given PID or name to launch before attaching.
-w Alias for –wait-for
Break the flow
To perform debugging we should have the ability to stop somehow the process and to inspect different aspects of it. Here, we got a problem, that can be solved in many ways.
The most used way to do this - is to use breakpoints.
Check this official doc for all available options
Let’s review a few of the most used commands.
set breakpoint
We can set a breakpoint in different ways:
- on a specific line in the current context:
breakpoint set -line <LineNumber>(lldb) breakpoint set –line 12
- on a specific line in the selected file:
breakpoint set --file <FileName> -line <LineNumber>(lldb) breakpoint set –file main.c –line 12
- using method basename
breakpoint set --method <MethodName>breakpoint set –method main
- using selector
breakpoint set --selector <Selector>breakpoint set –selector length
There are much more than this, but in most cases, these few can do the work for u.
Again, using xCode it’s can be dome much easier - u have a special GUI designed for this purpose - just click on the line number in a text editor from xCode or by using the Breakpoints side panel.
delete breakpoint
Removing breakpoints it’s also possible. To do this, we should be able to list all breakpoints and then, by selecting concrete one, remove it.
- list breakpoints
breakpoint listbreakpoint list
- remove breakpoints (to remove we should use breakpoint id from the command above)
breakpoint delete <ID> breakpoint delete 1
Practice
I wrote a lot of dry theory, this is good if u want to become a bit more familiar with something, but, for real skills, u need practice. So, let’s do a simple exercise, for practicing this.
We are going to create a simple program, then, we will debug it using commands from the list above.
First, let’s check, that lldb is installed. To do so, we can simply check the version of lldb.
lldb -versionApple Swift version 5.4 (swiftlang-1205.0.26.9 clang-1205.0.19.55)
we also can check the clang version:
Clangis a compiler front end for the C, C++, Objective-C, and Objective-C++ programming languages, as well as the OpenMP, OpenCL, RenderScript, CUDA, and HIP frameworks. It uses the LLVM compiler infrastructure as its back end and has been part of the LLVM release cycle since LLVM 2.6. wiki
cc -versionApple clang version 12.0.5 (clang-1205.0.22.9)
Target: arm64-apple-darwin20.4.0
Thread model: posix
InstalledDir: /Library/Developer/CommandLineTools/usr/bin
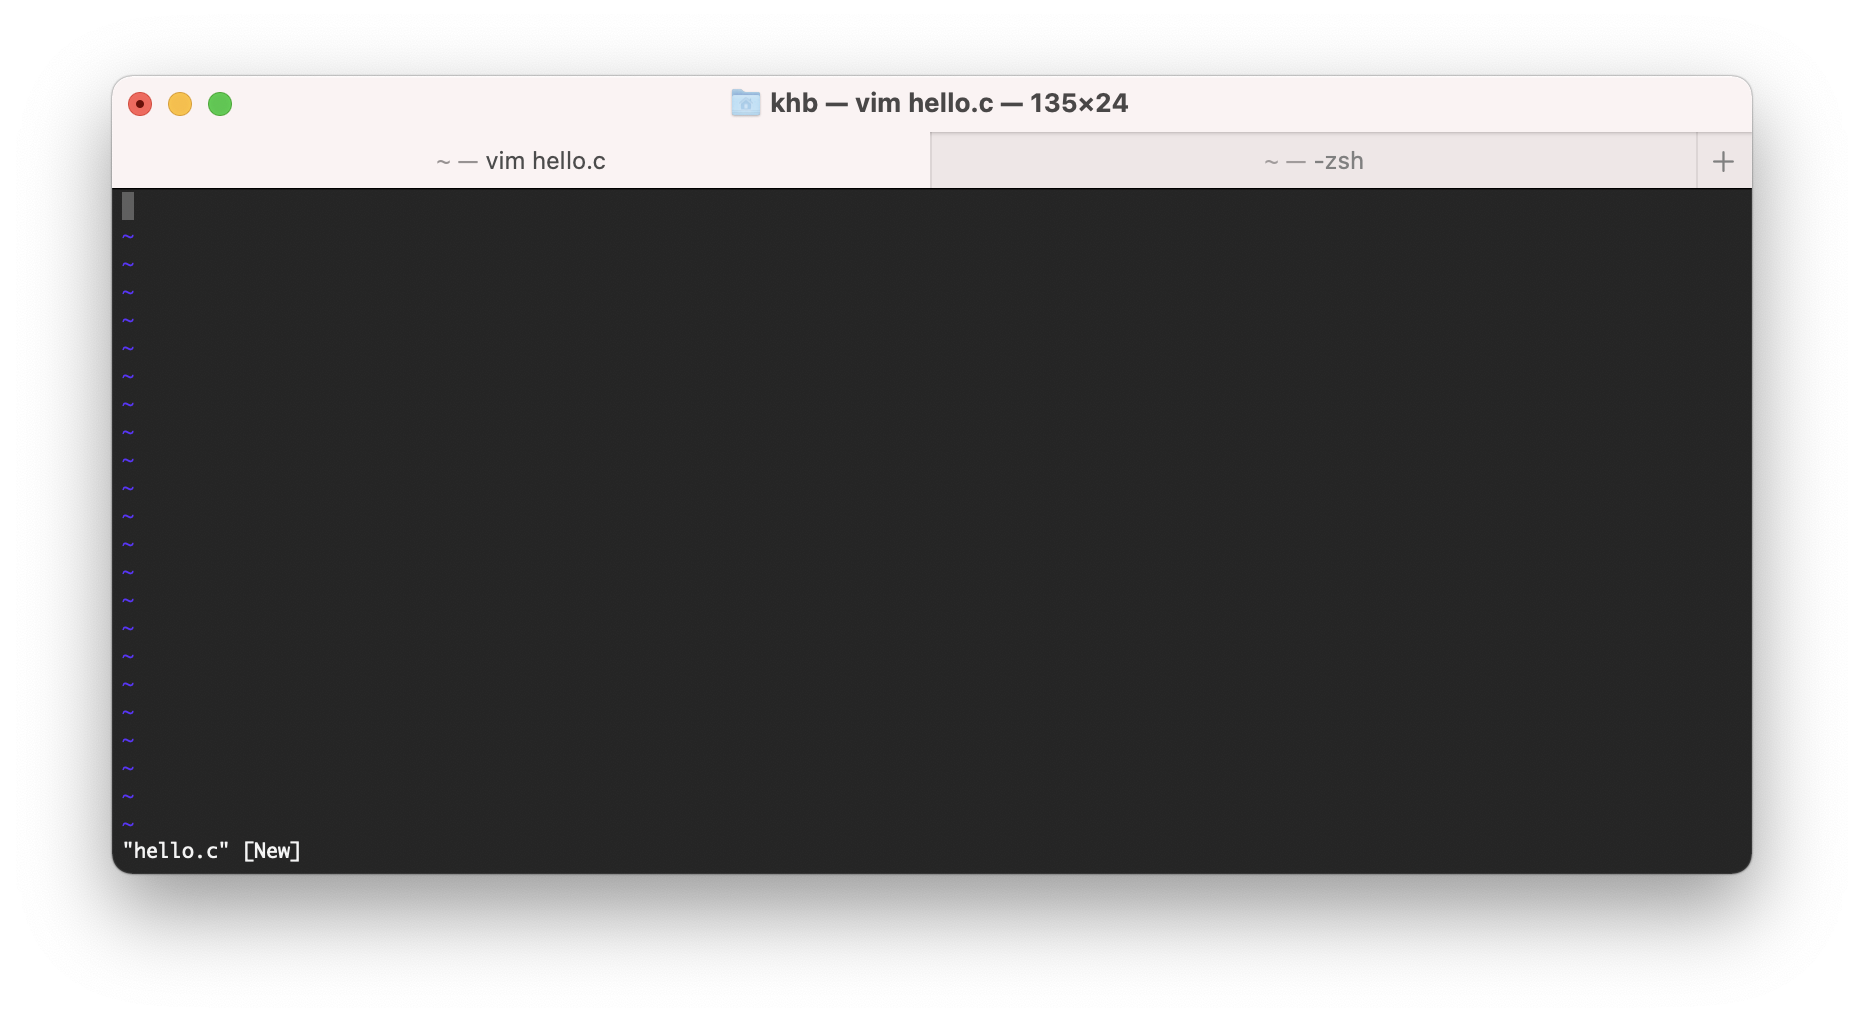
Next, let’s create a program file, using vim editor:
vim hello.cU should be able to see vim editor:
Now, let’s type our simple program for testing:
#include <stdio.h>
int main(int args, char** argv) {
	printf("Hello world!\n");
	return 0;
}
When u has done, press ESC and then press Shift+z+z to save.
I won’t cover the full spec of commands for vim editor, instead, u can always find some tutorial for it, like this one.
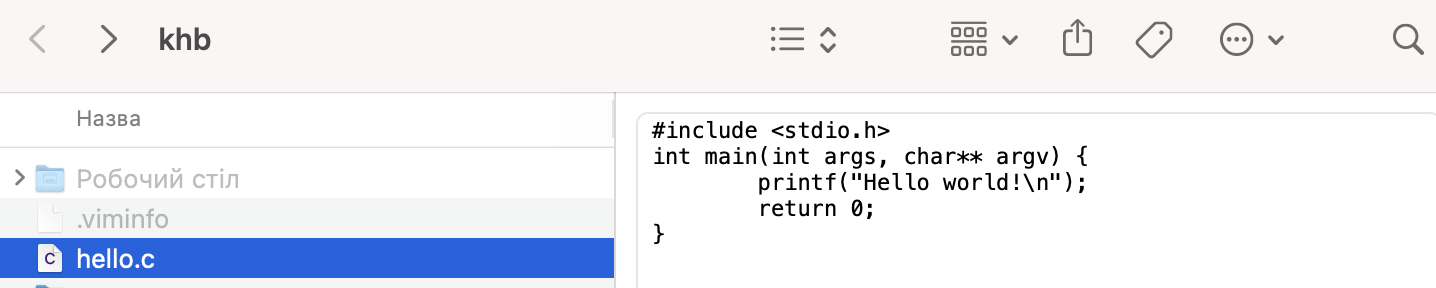
Now, if u check u’r active directory - file hello.c should be there with typed program inside it:
Now, let’s build the code:
cc -g --std=c99 -Wall hello.c -o hellowhere
-g It tells our compiler to embed debugging info inside the output file (Symbol Table, as an example)
–std=c99 The standard of C language that we are using
-Wall Catch all the warnings
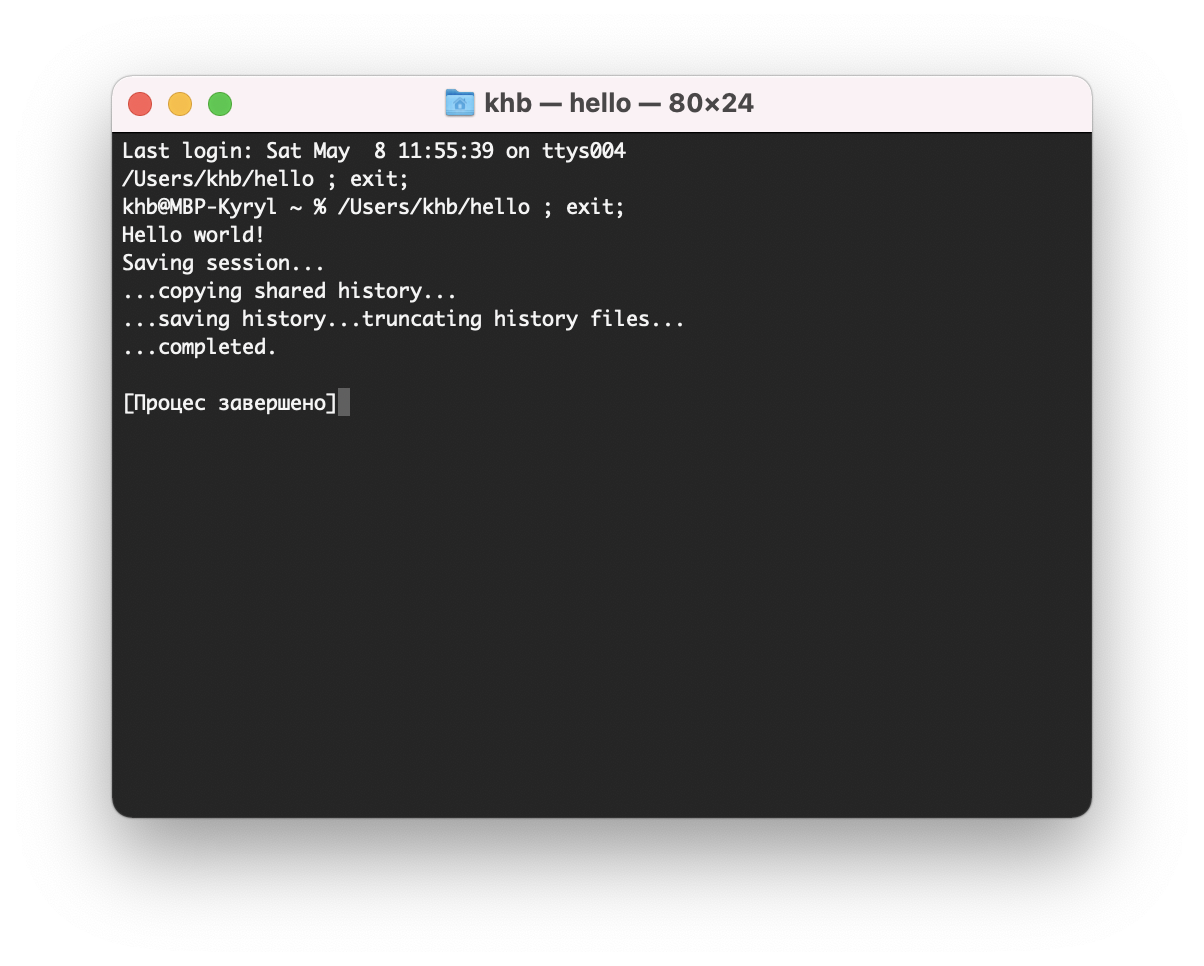
As result, hello.dSYM and hello executable file will be generated, and if u launch the hello executable, u will see output “Hello world!”:
Now, let’s try to run it using lldb:
lldb hello
run
khb@MBP-Kyryl ~ % lldb hello
(lldb) target create “hello”
Current executable set to ‘/Users/khb/hello’ (arm64).
(lldb) run
Process 32193 launched: ‘/Users/khb/hello’ (arm64)
Hello world!
Process 32193 exited with status = 0 (0x00000000)
As u can see, a program is executed, but we haven’t any possibility to inspect some variables or so.
Imagine, that we made a mistake. How we can inspect something? or stop the code? Of cause - use breakpoints:
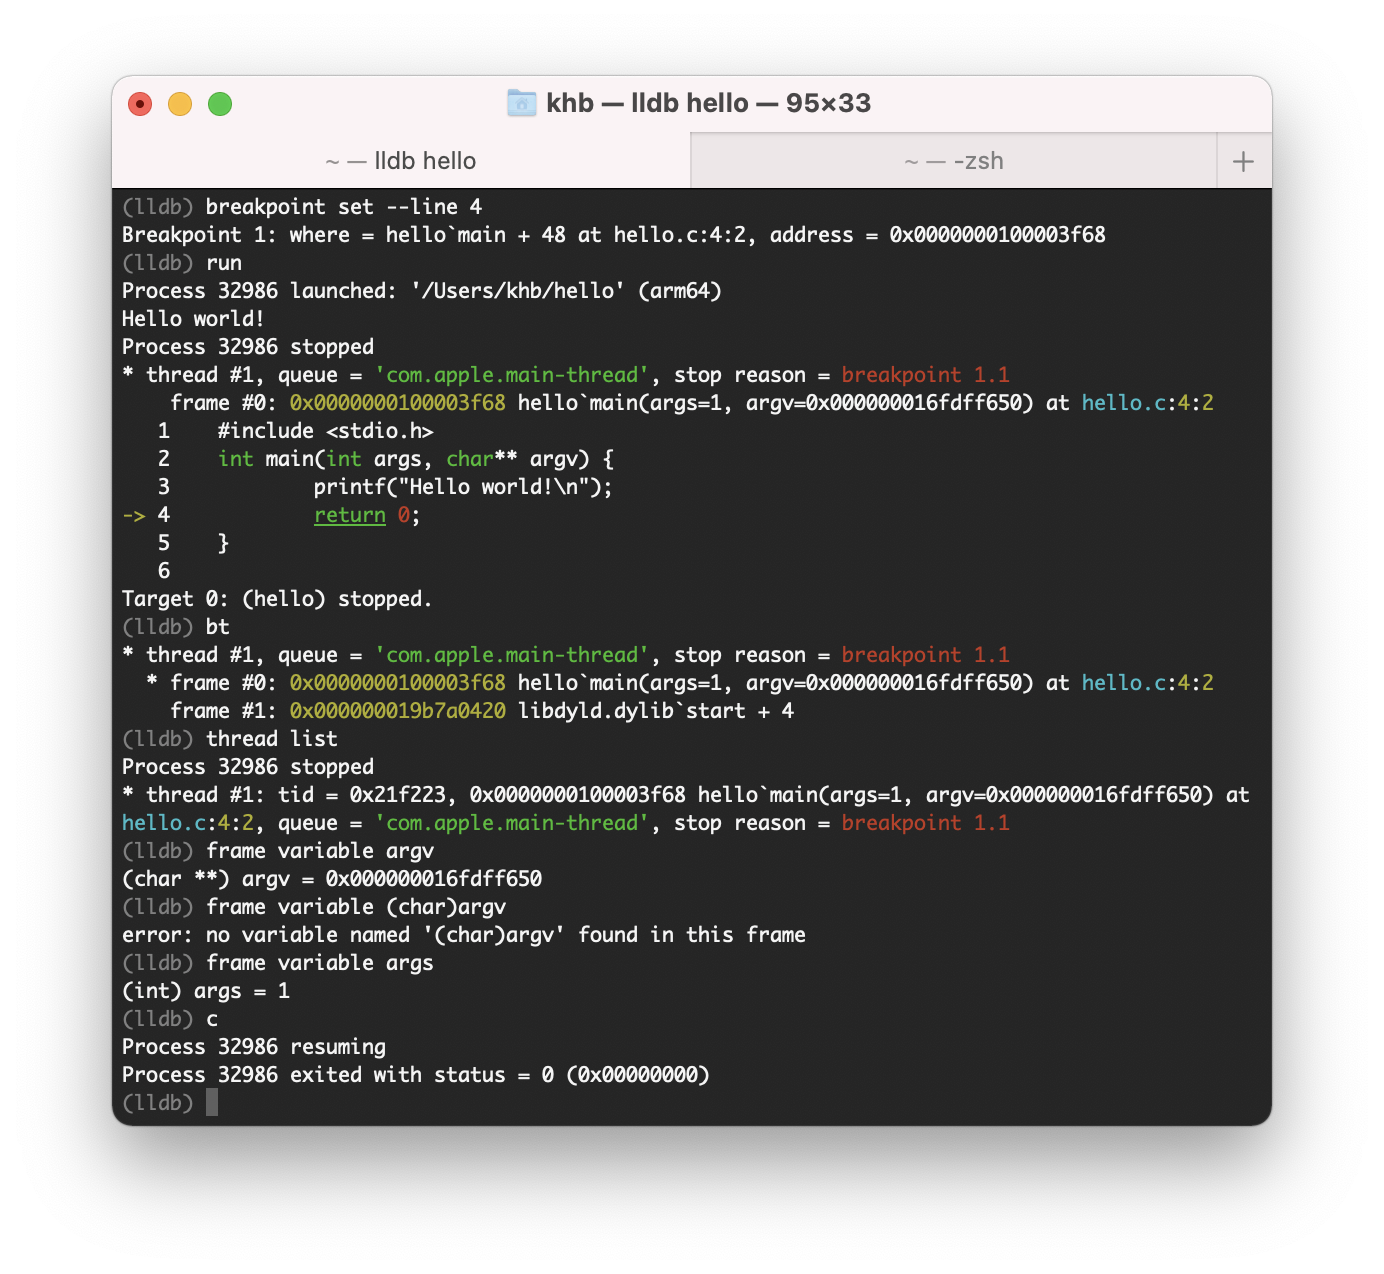
add one and perform some test using commands (one-by-one):
// add breakpoint at line 4
breakpoint set --line 4
// run target
run
// same as breakpoint, but shorter - show breakpoint
bt
// show list of threads
thread list
// check frame and variable with name argv
frame variable argv
// c is same as continue - continue run program
c
In my case, output is something like this:
Breakpoints are great, but how we can inspect/change variables? Let’s play a bit more:
terminate the current session by pressing ctrl+z:
zsh: suspended lldb hello
Now, let’s modify a bit our hello.c by typing vim hello.c and changing content to next:
#include <stdio.h>

int main(int argc, char *argv[]) {
  int i;
  printf("argc: %d\n", argc);
  printf("argv[0]:  %s\n", argv[0]);
  if (argc == 1) {
    printf("No arguments were passed.\n");
  } else {
    printf("Arguments:\n");
    for ( i = 1; i < argc; ++i ) {
      printf("  %d. %s\n", i, argv[i]);
    }
  }
  return 0;
}
Now, if u try to run and set a breakpoint - u still will see the previous version of our app - u need to rebuild the app, so changes become visible:
cc -g --std=c99 -Wall hello.c -o helloLet’s run now our program:
cc -g --std=c99 -Wall hello.c -o hello
lldb hello
run firstParam secondParam
Output:
Process 33126 launched: '/Users/khb/hello' (arm64)
argc: 3
argv[0]: /Users/khb/hello
Arguments:
1. firstParam
2. secondParam
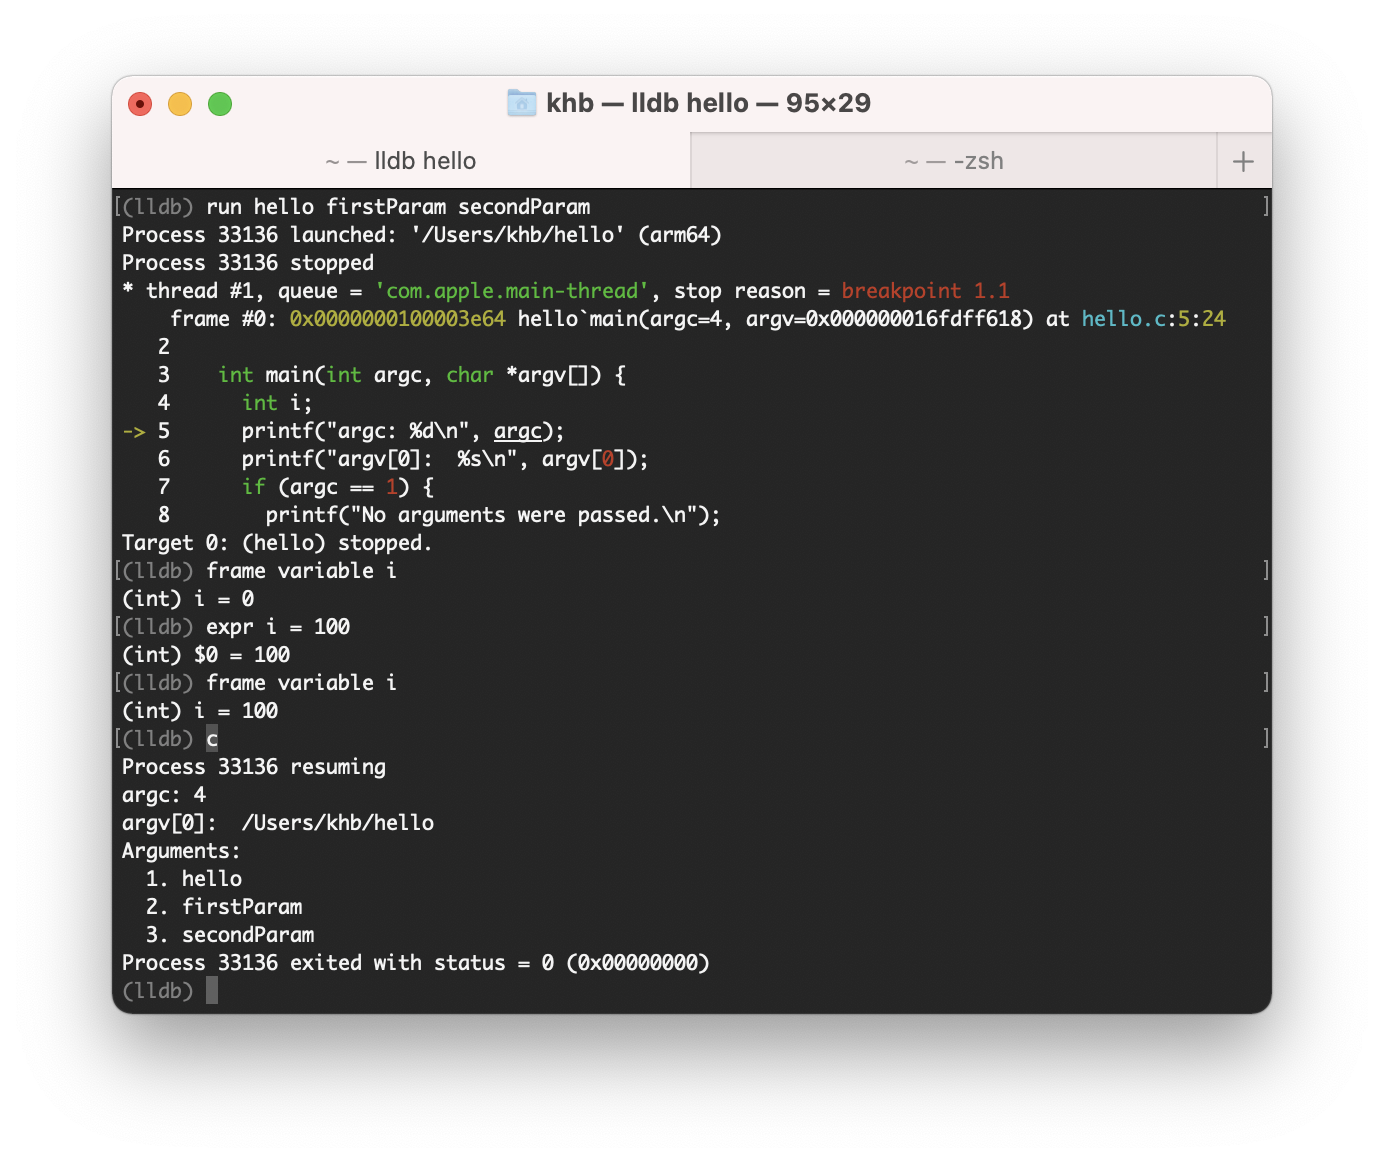
Process 33126 exited with status = 0 (0x00000000) If we add few more breakpoints, we can inspect and change our variables:
// run program with 3 params
run hello firstParam secondParam
// check value for i variable
frame variable i
// set value for i variable
expr i = 100
// check value for i variable
frame variable i
// continue
c
Output:
Conclusion
Thankfully to a variety of the commands, we can easily and quickly debug our application. Try to explore lldb a bit more and test some other commands.
In the next articles, I will cover other aspects of the work with lldb.
Articles in this series:
- The LLDB Debugger - Part 1: Basics
- The LLDB Debugger - Part 2: Breakpoints
- The LLDB Debugger - Part 3: Watchpoint
Resources:
Share on: