All the world around
iOS swift SwiftUI Shape Map Estimated reading time: 10 minutesMaking interactive components it’s always fun and interesting - u may discover something unknown for u or dive into some area that looks simple at first.
Country - is a part of our world. Often we must specify or change some aspect depending on this value. Creating components that allows easely select and work with country-object - is the topic for this article.
Problem
Need to show map and allow to select any country on it.
Solution
- use map (any available) and show representation of the world and countries by managing layers and tiles with shapes.
- draw layered image and interact within it
Every possible solution has it’s own proc and cons.
The first one require map integration and hard logic for countries. In case we want to change something - we must do this using framework components, that is usually hard and non-efficient. Good side of this solutions will be a well tested and defined functionality.
The second one solution - very flexible, but require additional work from us - in both implementation and testing.
Thus we would like to get flexible solution, I choosed the second one.
Implementation
As usual, let’s divide our problem into few parts:
- data source: needed to well define boundaries of the world and countries for displaying and interaction
- rendering on screen and integration with other UI
- handling interaction: tap for select/deselect, etc
- animation: to make it smooth and user-friendly
Well, we can define even more steps, but this 4 is minimum required for making a good component.
Data source
RawData
For rendering something we need to show it in some way, we need data. For us this can be a path - in other words, a set of points. Good for us, that we already have a lot of systems created for map representation in graphical way. Thus we have 2D screen, Mercator projection is ideally fits for our needs.
What we need - it’s a Mercator map projection converted into set of coordinates converted in x and y, so we can draw it. In other word some set of points in any available format, so we can parse it and use this models in our project.
Luckly for us, there are a lot formats that can store such data in sutable way - json, geojson, shape, csv, kml, xml, svg… and much more.
Another good question - where to find this data. Well, a lot of organization collect and store that data:
I choose to use data from open-source Natural-Earth project.
The downside of this selection - is that
Natural Earth draws boundaries of sovereign states according to de facto (“in fact”) status rather than de jure (“by law”). We show who actually controls the situation on the ground because it turns out laws vary country to country, and countries are only loosely bound by international law in their dealings with each other. While our de facto policy does not please everyone, it is rigorous and self consistent.
so be aware of this.
We can download data with different resolutions and so accuracy. The more accuracy - the bigger weight.
Download link for file used in proj
The good point in this data - if needed u can adjust it at any time. For this purpose u can use any of many available tools for editing geojson file. As adviced by Pascalco, we can use various tools for modification of this file.
I used https://mapshaper.org/ - because it’s online and my editing needs is minimal.
First, we need to reduce the size a bit - for this purpose we can use one of the available algoritms at mapshaper and just select required accuracy and perform export of the file.
Simplification available from top menu
We also can edit borders of any shape and add additional properties if needed for any object.
the best way to check - just play a bit with this and other tools
Data model
Now we are moving to one of the interesting parts - we will get our hands dirty!
To get the models, we can simply inspect the file content with some text editor and parse JSON to get all data we need.
The good way to do this - is read about geojson format at first. The full documentation available here.
{
  "type": "Feature",
  "geometry": {
    "type": "Point",
    "coordinates": [31.1656, 48.3794]
  },
  "properties": {
    "name": "Ukraine"
  }
}
note here, that position of data in array - (lon, lat)…. For example
"bbox": [-180.0, minlat, 180.0, 90.0]for North Pole
We can note from spec above, that we need next values:
bbox- for getting rect in which country is located- various
geometry- like point, line, polygon or multypolygon properties- to get additional info about country
Keeping this in mind, we can create a model that will utilize this.
Alternatively u can use various gsonToModel mapper like quicktype.io
Result - a set of models that u need. I put everything into one package, so it becomes reusable:
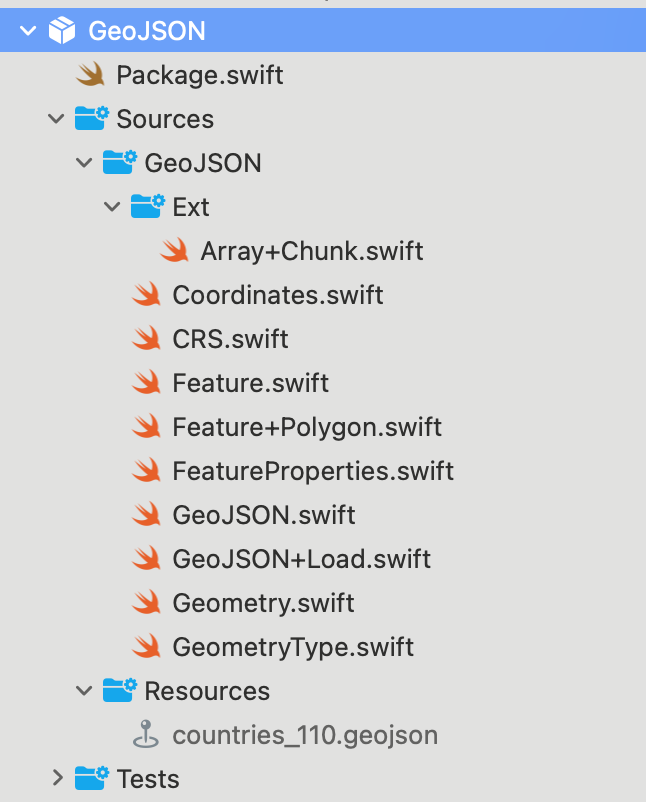
source code for this package available here
Rendering data on screen
This part we will achieve using SwiftUI and Shape objects.
Idea - is to convert (lat, long) into (x, y) on a screen rect and draw it.
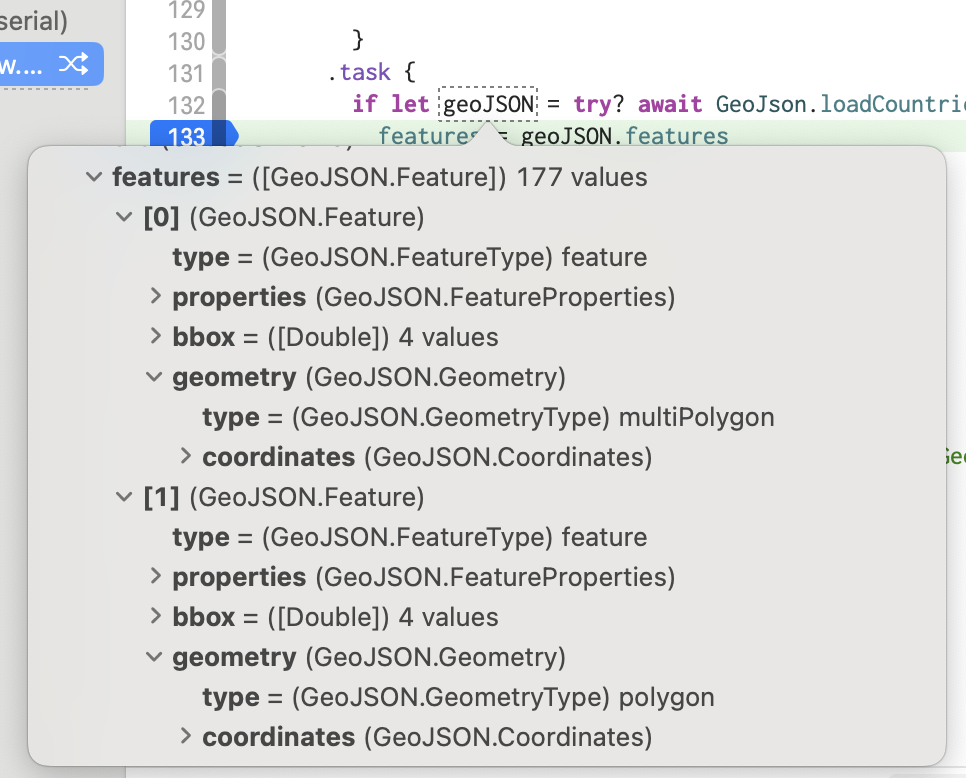
In objects, that we parse from geoJson there are a lot of geometry-object - 1 for each country. A country can contain a few nested polygons (different types) - 1 per separate territory. So we must analyze this data and to draw a path for each polygon.
The first step - we must represent each set of data points [long, lat] as some concrete type, for example CLLocationCoordinate2D.
func toPointsMap(_ pointMap: [[Double]]) -> [CLLocationCoordinate2D] {
  pointMap
    .map { coordinate in
        .init(latitude: coordinate[1], longitude: coordinate[0])
    }
}
Utilizing this func, we can add accessor for all polygons that is currently interested in us:
extension Feature {
  public var polygons: [GeoJsonPolygon] {
    func toPointsMap(_ pointMap: [[Double]]) -> [CLLocationCoordinate2D] {
      pointMap
        .map { coordinate in
            .init(latitude: coordinate[1], longitude: coordinate[0])
        }
    }

    var objects: [GeoJsonPolygon] = []
    if geometry.type == .polygon,
       let coordinates = geometry.coordinates.polygon {
      objects = coordinates
        .map(toPointsMap(_:))
    }
    if geometry.type == .multiPolygon,
       let coordinates = geometry.coordinates.multiPolygon {
      objects = coordinates
        .map({ $0
          .map(toPointsMap(_:))
        })
        .flatMap({ $0 })
    }

    return objects
  }
}
Next step - is to convert CLLocationCoordinate2D into (x, y) on rect.
U may think that there is no purpose to twice convert object into different struct, and u may be right, but thus we have not so much data and clarity in the code is appreciated, it’s better to complete this step - such action improve code readability and maintability in the future, if we need to change something.
Converting location point into x and y a bit tricky, but as was mention earlier, we can use Mercator transformation.
The good question here - how much precision we want to achieve? Well, not much - we don’t want to show pin on map or use some navigation - we just want to see country borders and be able to select it.
Let’s start by defining our Shape - MapPolygon with no transformation for points:
struct MapPolygon: Shape {

  let coordinatePolygonPoints: [[CLLocationCoordinate2D]]

  func path(in rect: CGRect) -> Path {
    let root: [[CGPoint]] = coordinatePolygonPoints.map {
      $0.map { .init(x: $0.latitude, y: $0.longitude) }
    }

    let path: UIBezierPath = root.map { points in
      if points.isEmpty {
        return UIBezierPath()
      }

      let path = UIBezierPath()
      path.move(to: points[0])
      for point in points {
        if point.x.isNaN || point.y.isNaN {
          print(point)
        }
        path.addLine(to: point)
      }
      path.close()

      return path
    }
      .reduce(.init(), { $0.append($1); return $0 })

    return .init(path.cgPath)
  }
}
The naive assumption - is that we can just convert lat long into point:
As expected, this is a bit not what we expect.
In this case, we can use very simple process - we know limitation for lat and long:
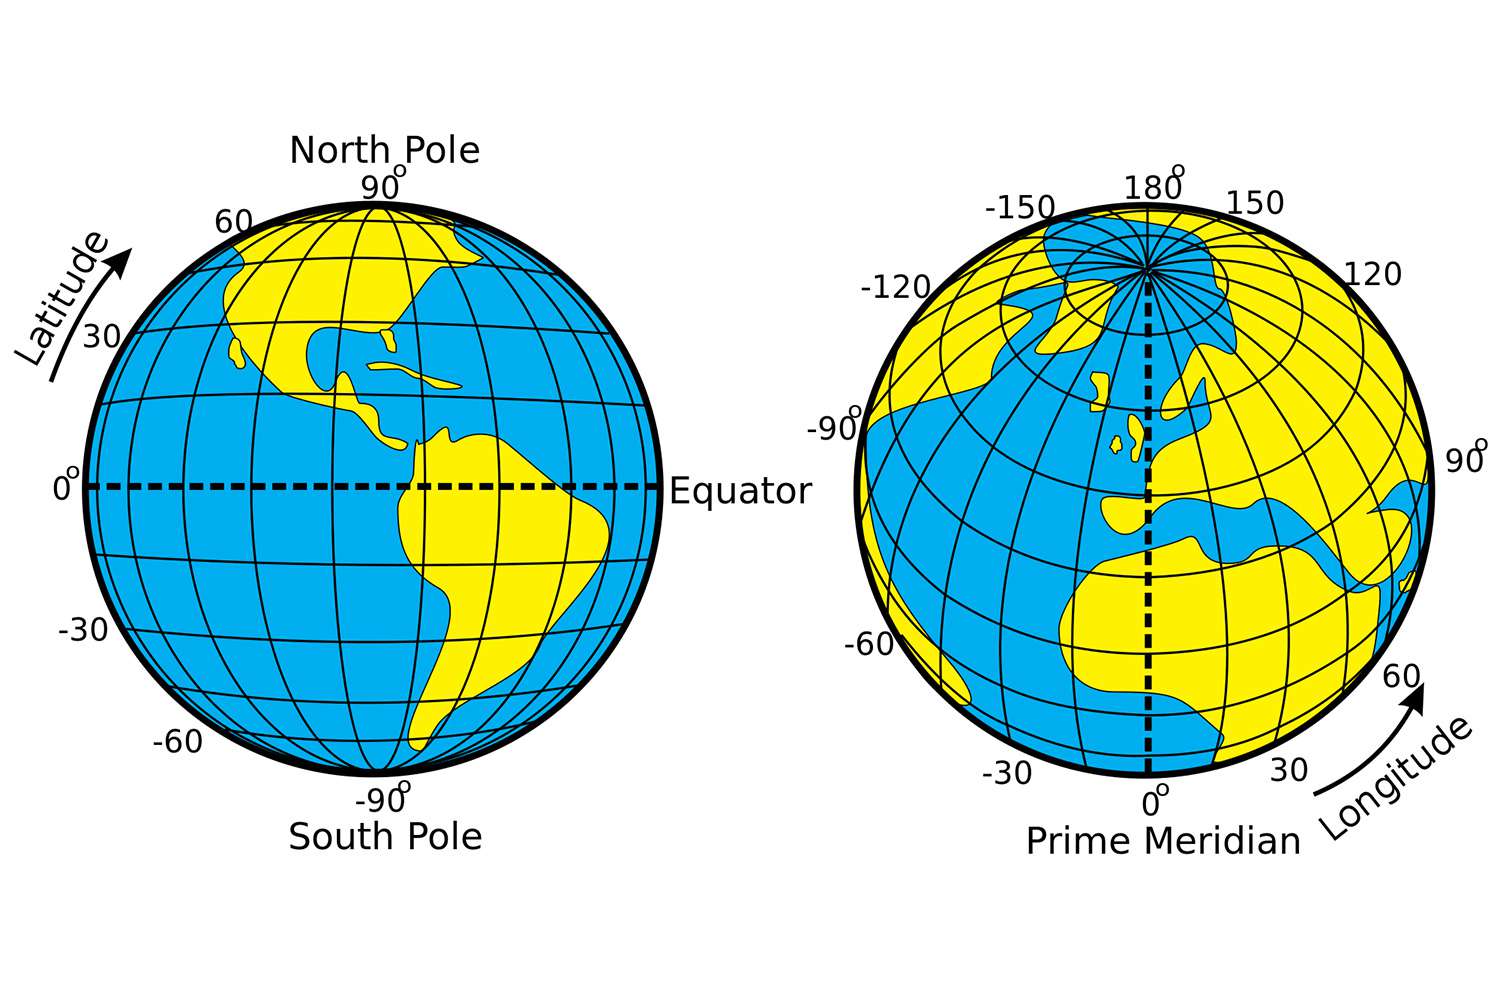
For latitude - is -90 - +90 degrees and for longitude - -180 - +180 degrees. We also know rendering view - rect with width and height. Another thing that we know - is that anchor point for data - 0.5, 0.5, in other words - center.
So all we need to do - is just rotate, translate and scale the values - all other action is done for us:
let y = ((rotation * latitude) + ABS(-90 + +90)*0.5) * (rect.height / ABS(-90 + +90))
let x = (longitude + ABS(-180 + +180)*0.5) * (rect.width / ABS(-180 + +180))
in other words:
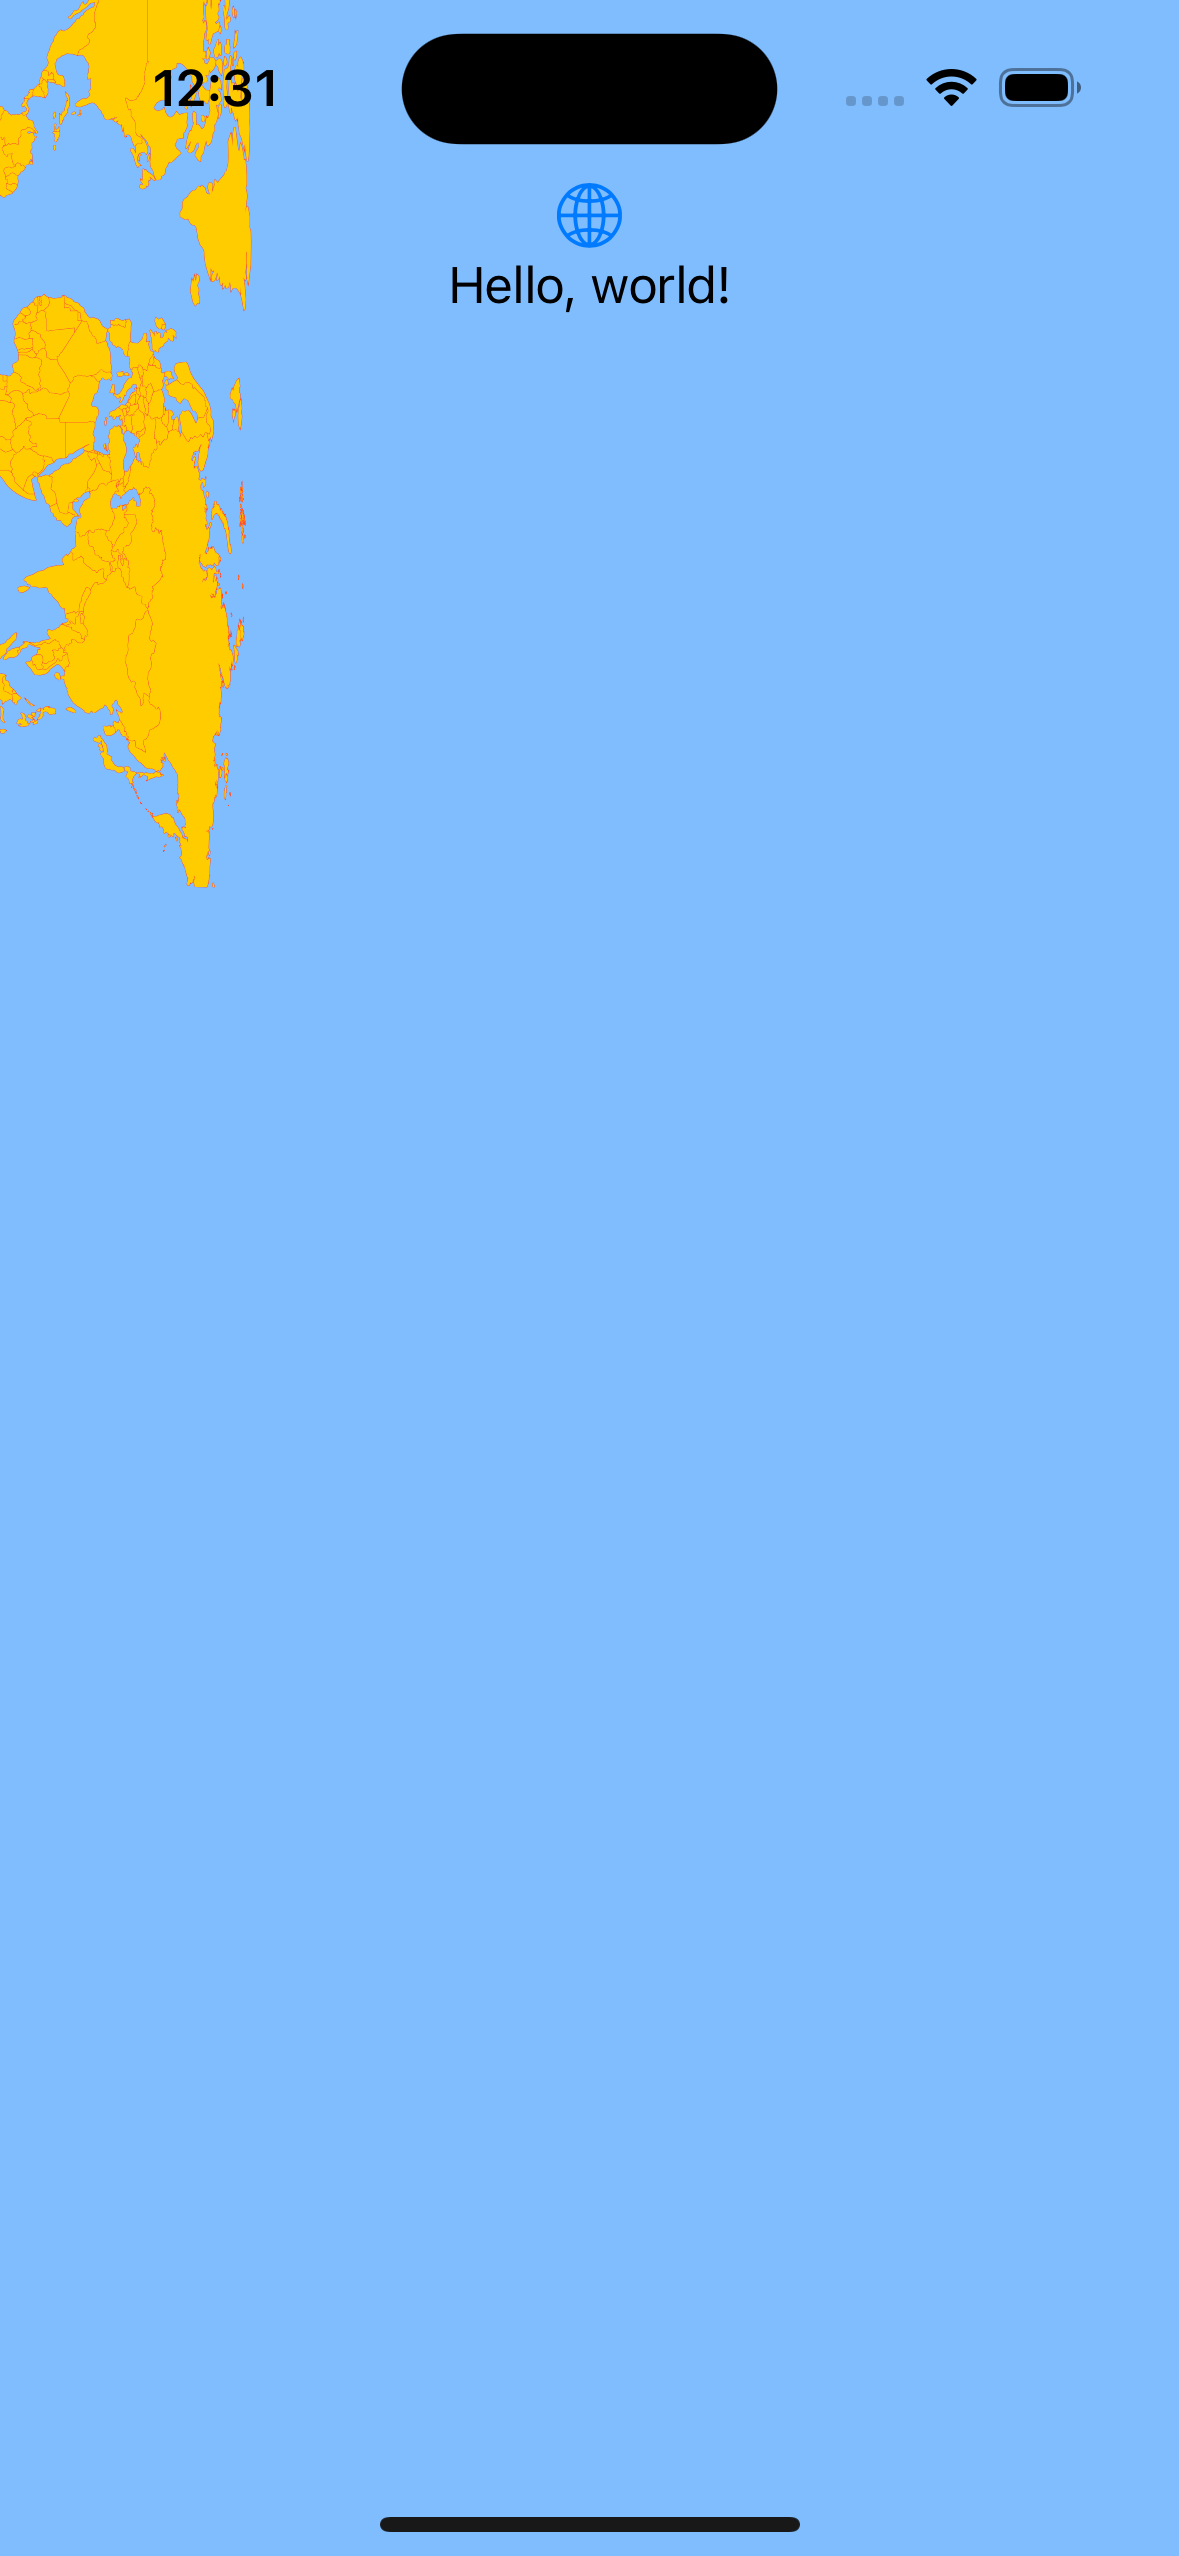
let y = ((-1 * latitude) + 90) * (rect.height / 180)
let x = (longitude + 180) * (rect.width / 360)
Result:
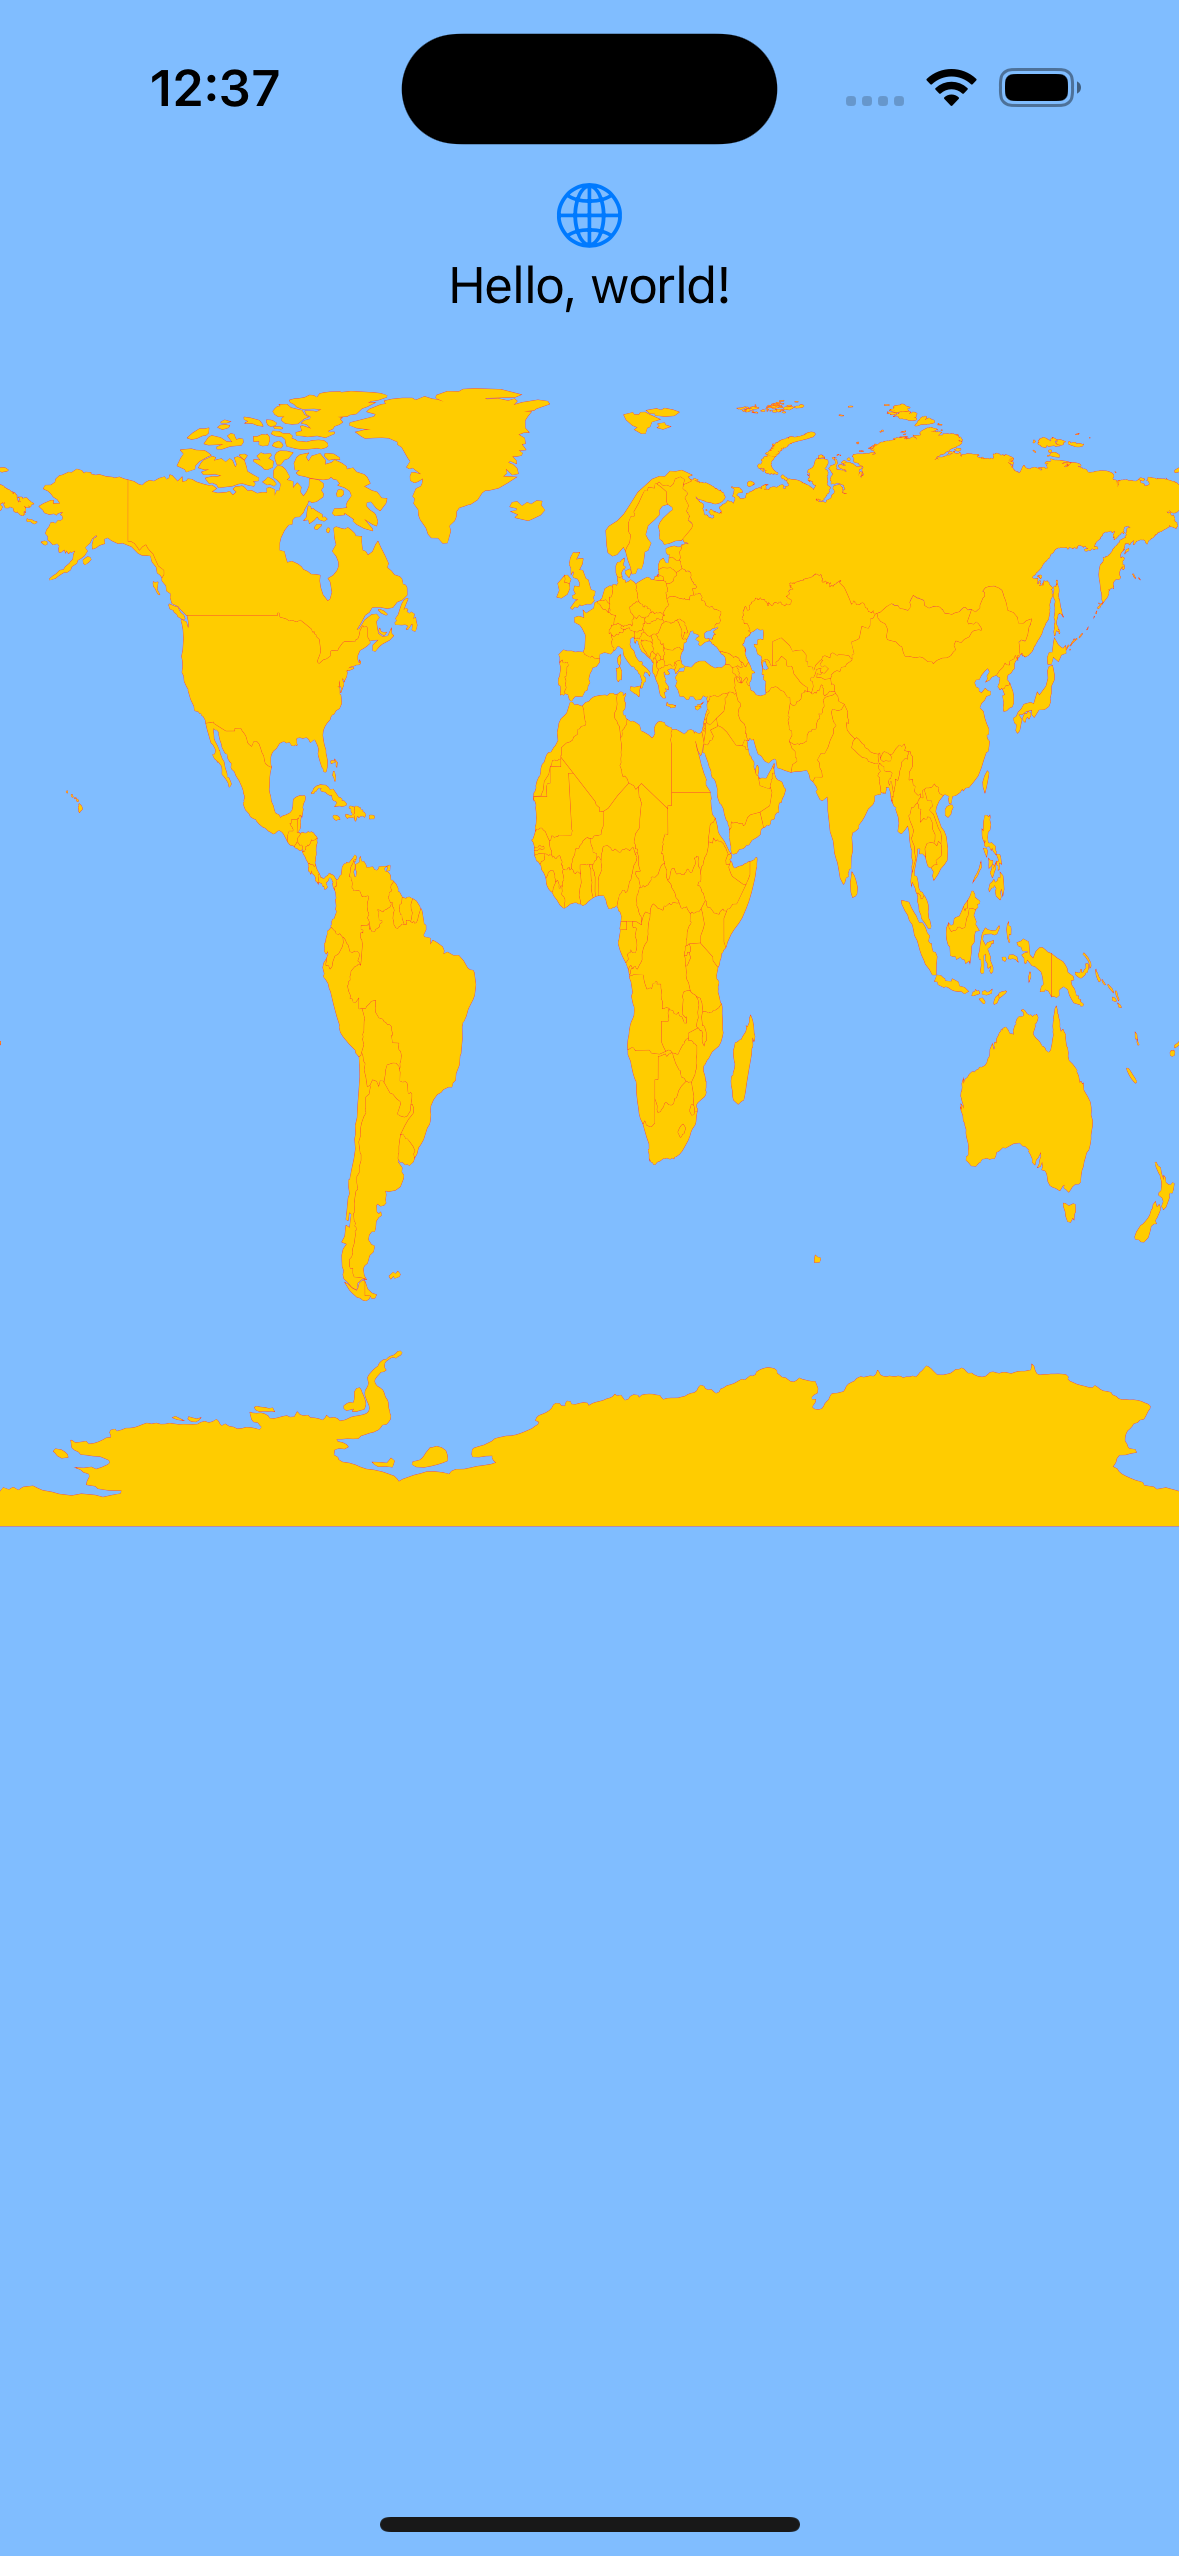
The full code for shape:
import Foundation
import UIKit
import SwiftUI
import CoreLocation

import GeoJSON

struct MapPolygon: Shape {

  let coordinatePolygonPoints: [[CLLocationCoordinate2D]]

  func path(in rect: CGRect) -> Path {
    let root = coordinatePolygonPoints.map {
      $0.map { $0.toPointIn(rect) }
    }

    let path: UIBezierPath = root.map { points in
      if points.isEmpty {
        return UIBezierPath()
      }

      let path = UIBezierPath()
      path.move(to: points[0])
      for point in points {
        if point.x.isNaN || point.y.isNaN {
          print(point)
        }
        path.addLine(to: point)
      }
      path.close()

      return path
    }
      .reduce(.init(), { $0.append($1); return $0 })

    return .init(path.cgPath)
  }
}

extension MapPolygon: Hashable, Equatable {

  public func hash(into hasher: inout Hasher) {
    hasher.combine(coordinatePolygonPoints.hashValue)
  }
}

extension CLLocationCoordinate2D {
  func toPointIn(_ rect: CGRect) -> CGPoint {
    let y = ((-1 * latitude) + 90) * (rect.height / 180)
    let x = (longitude + 180) * (rect.width / 360)
    return .init(x: x, y: y)
  }
}

extension MapPolygon {
  init(_ feature: Feature) {
    self = .init(coordinatePolygonPoints: feature.polygons)
  }
}
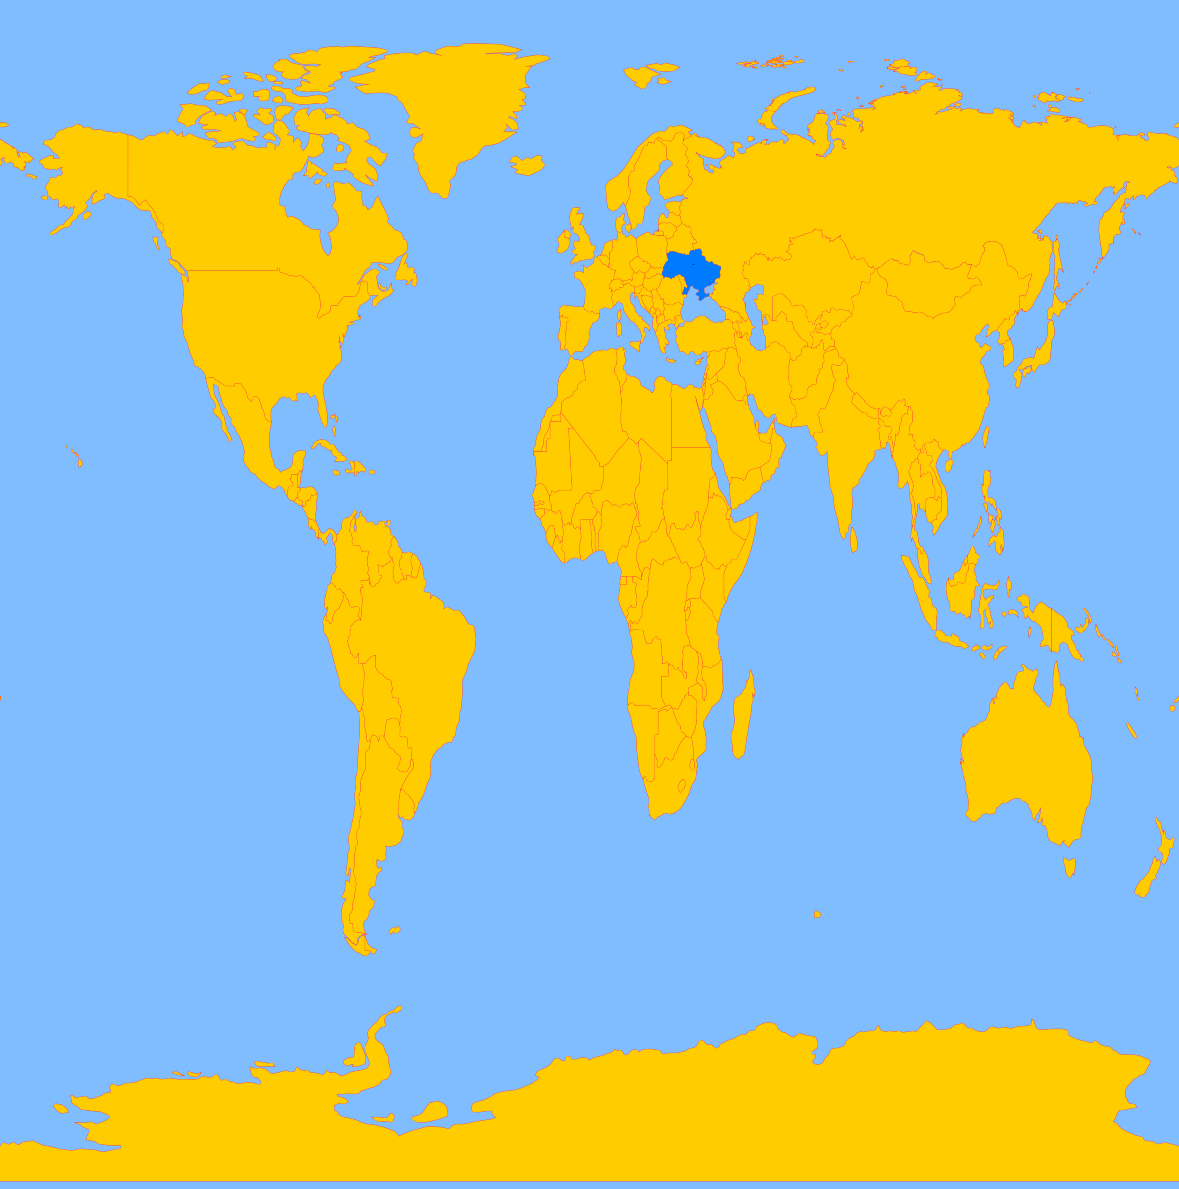
Interaction - this is nice to have thing. We can use tap gesture. To show that user select something - we could use color hightliting:
MapPolygon(element)
  .stroke(.red, style: StrokeStyle(lineWidth: 0.25))
  .fill(element.name == selected ? .blue : .yellow)
  .onTapGesture { _ in
    selected = element.name == selected ? nil : element.name
  }
Depends on your needs, it’s possible to add scale, or even some other info when u select country. With zoom, we must play a bit - we want to scale to specific are - boundingBox (bBox) of the country:
  .onTapGesture { _ in
    let unselected = element.name == selected

    let bb = element.bBox
      .map({ $0.toPointIn(.init(origin: .zero, size: proxy.size)) })
    let elementWidth = abs(bb[0].x - bb[1].x)
    let elementHeight = abs(bb[0].y - bb[1].y)

    let elementWidthN =  proxy.size.width / elementWidth
    let elementHeightN = proxy.size.height / elementHeight

    let maxKoef = min(min(elementWidthN, elementHeightN) * 0.9, 10)

    let anchor = UnitPoint(
      x: (bb[1].x - abs(bb[1].x - bb[0].x)/2) / proxy.size.width,
      y: (bb[1].y - abs(bb[1].y - bb[0].y)/2) / proxy.size.height
    )

    zoom = unselected ? 1.0 : maxKoef
    selected = unselected ? nil : element.name
    zoomAnchor = unselected ? .center : anchor
  }
  .scaleEffect(zoom, anchor: zoomAnchor)
The full result:
Conclusion
As always - if u have a task, divide it into separate parts and do it one-by-one. Perform various experiments and always do a bit more than needed.
Source code
The source code available here
Materials
Share on: